Gaps in hospital safety and quality have prompted public and private payers to push for greater accountability through clinical quality measurement and reporting initiatives, which have grown rapidly in the past two decades. With U.S. health care costs high and rising, purchasers increasingly are seeking to identify high-value hospitals that deliver good care at a reasonable price. Some payers are incorporating clinical quality measurement into health plan contracting and benefit designs to alter provider networks and patient cost sharing to guide patients toward higher-performing hospitals. Yet, amid the proliferation of new quality measures, reporting requirements and transparency efforts over the past 20 years, employers often find it difficult to separate the signal from the noise—to determine what hospital quality measures are important, how to interpret and use quality information in a meaningful way, and how to present useful and actionable information to consumers. To pursue purchasing strategies that push providers to meet standards of care for cost and quality, employers must understand the availability, validity and relevance of existing quality measures for their own enrollees. Purchasers also might consider how to promote more effective quality reporting by streamlining provider reporting requirements, supporting consistency in quality designations and exploring new ways to measure aspects of quality important to both patients and payers.
- Growth of Quality Measurement and Reporting
- The Imperfect Science of Quality Measurement
- Types of Quality Measures
- Challenges to Meaningful Measurement
- Measure Maintenance and Certification
- Health Information Technology and Quality Measurement
- Key Elements of an Active Purchasing Strategy
- Purchasers Can Promote Effective Quality Reporting
- Key Takeaways for Purchasers
- Notes
Growth of Quality Measurement and Reporting
The Institute of Medicine’s groundbreaking 2001 Crossing the Quality Chasm report described the systemic challenges hospitals faced in providing safe, appropriate care—early quality improvement efforts resembled “a team of engineers trying to break the sound barrier by tinkering with a Model T Ford.”1 In the decade that followed, most hospitals—sometimes willingly, sometimes grudgingly—accepted quality improvement as a core part of their mission amid growing evidence that well-designed interventions can diminish pervasive patient safety hazards in hospitals.2
Given the high potential rewards for improving the quality of hospital care, both public and private entities have developed hospital quality measurement efforts, leading to a proliferation of clinical quality measures. For example, more than 30 separate measures evaluate the quality of hospitals’ cardiac surgery programs, ranging from aspects of care as general as postoperative mortality rates and as specific as whether patients’ blood glucose was adequately controlled after surgery.3
Public and private groups have developed report cards that seek to organize the crowded clinical quality measure landscape, either by collecting their own results or by repackaging publicly available data, but the report cards have proliferated as well.4 There is even a consumer guide from the Informed Patient Institute that identifies the strengths and weaknesses of various quality report cards.5 The availability of quality information is slowly changing the environment in which purchasers and consumers consider health benefits and choice of providers. As more purchasers consider quality measurement as a standard contracting and decision-making tool, it is unclear how many consumers would need to shift to higher-quality providers to achieve a tipping point in the market.
Employers interested in maximizing the value of health care spending—shaping more selective provider networks that offer higher quality at a lower cost—are seeking to identify meaningful differences in measured quality among hospitals and to understand how those differences translate into better patient outcomes and lower costs. To this end, purchasers must understand the uses of quality information, and how it can—and cannot—be used before incorporating it into purchasing decisions. This policy analysis:
- provides an overview of the quality measure development process and types of available data and measurement;
- outlines key elements of an active purchasing strategy and ways quality indicators might help shape contracting and benefit design decisions;
- discusses ways purchasers can improve quality measurement and transparency efforts to make information more available, reliable and actionable; and
- highlights the direction of quality measure development, in particular the ways that electronic health records (EHRs) will create new approaches to performance measurement.
The Imperfect Science of Quality Measurement
Purchasers seeking to ensure value are most interested in aspects of quality that are easy to measure, reliable and consistently predict important outcomes—such as mortality, cost of care and patient satisfaction. This combination of attributes turns out to be relatively rare: Aspects of care that are easy to measure often have little to do with important outcomes, and many important outcomes are difficult to measure in a consistent manner that fairly adjusts for differences in patient populations.
Quality measure developers range from academic medical centers to physician specialty societies to independent quality organizations, such as the National Committee for Quality Assurance (NCQA). These groups gather scientific evidence and stakeholder input to decide what aspects of care to measure, how to collect needed information and how to report the results. All seek to develop measures with the following key attributes:
- importance—what is measured affects patients and payers;
- validity—what is measured truly represents high-quality care;
- accuracy and reliability—the measurement captures the care of interest correctly and consistently over time; and
- feasibility—needed information is not overly burdensome to collect.
Types of Quality Measures
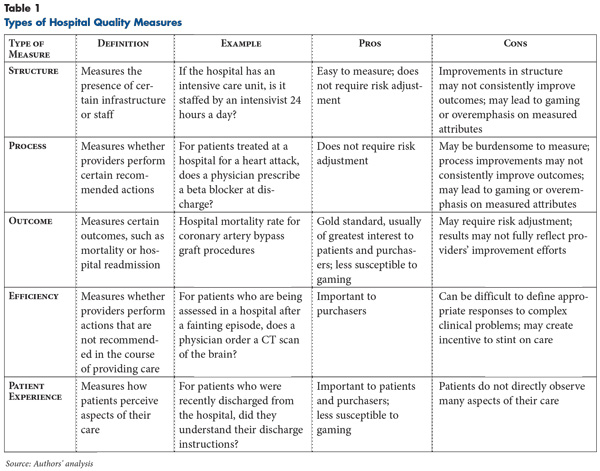
Generally, hospital quality measures assess specific attributes of care that are widely agreed to signify good practice or, more rarely, assess outcomes directly (see Table 1 for more about types of measures).
Structural measures look for the presence of infrastructure or staff associated with improved outcomes, such as intensive care units staffed by designated, specially trained physicians known as intensivists.6 Process measures look for performance of actions that lead to improved outcomes, while efficiency measures assess the absence of processes deemed unnecessary or potentially harmful. For example, a process measure evaluates how many physicians prescribe beta blockers to patients who suffered heart attacks—a recommended action7—while an efficiency measure evaluates how many physicians prescribe antibiotics to children with a likely viral upper respiratory tract infection—an inadvisable action.8
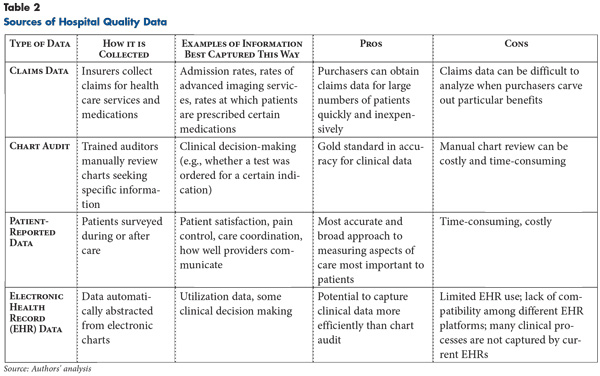
Care outcomes, such as mortality associated with a particular procedure or clinical condition, are more difficult to capture and assess across providers caring for diverse patient populations. For example, patients with more severe underlying illnesses or who face more barriers to obtaining care may have worse outcomes through no fault of the provider. Nonetheless, developing outcome measures is a particular area of focus given their direct relevance to patients and payers. Patient experience measures can be considered a subset of outcome measures and generally capture patients’ perceptions of whether providers listened to them and addressed their concerns (see Table 2 for more about sources of hospital quality data).
Each type of measure has strengths and limitations. Structures and processes can be assessed relatively easily and inexpensively. Annual hospital surveys, for example, can capture structural factors, such as nurse staffing levels, while claims data can capture many processes, including visits, lab tests or prescriptions. However, structural elements evaluated in these measures are a proxy for quality and valid only if controlled studies correlate their presence to important outcomes. And, the association can be muddied if, for example, organizations that generally are more effective also are more likely to adopt the specific structural elements studied.9
Process measures also must be directly tied to outcomes and sometimes require patient chart audits if the process being assessed is not reliably associated with a particular billing code. For these reasons, the usefulness of structure and process measures is limited by the relatively small number that have been carefully studied to develop evidence-backed best practices widely applicable across patient populations. While measures are tested during development to document reliability and validity, they can still be misinterpreted and misused. Both structure and process measures can be gamed by providers that develop the minimum infrastructure or perform actions that meet the literal requirements of a measure, without truly following the measure’s intent.
Outcomes measures, such as mortality or hospital-acquired infection rates, by definition measure direct impact on patient care. Some outcomes can be captured with relative ease since they generate additional actions within the health system—for example, additional days of hospitalization or readmission once a patient has been discharged. However, small sample sizes because of limited procedure volume can limit the ability to report performance fairly and distinguish meaningful differences in outcomes across facilities. Determining how much one provider’s care contributes to a particular outcome also can be difficult—outcomes typically require risk adjustment to ensure that providers caring for sicker, more challenging patients are not unfairly penalized. Some outcomes of particular interest to employers, such as variation in post-operative recovery time after hospital discharge, which may affect organizational productivity, are not captured at all in hospital data reporting. And others, such as the degree to which providers coordinate care, are difficult to capture in any data. Still others, like having a heart attack or stroke because of hypertension, can occur years after initial treatment decisions.
Efficiency, defined as determining an optimal relationship between costs and benefits, is important to payers and patients but harder to measure because it requires determination of appropriateness—whether and how much someone benefits from the treatment—as well as cost. Determining whether an action was truly unnecessary without detailed review of a patient’s medical record can be difficult, and even then, critical data may be lacking. Capturing patients’ experience of care is also challenging in terms of data collection since it requires surveying patients about their care, usually after they have left the hospital. Most often, patient satisfaction and experience of care are measured using publicly available surveys that have been validated, such as the Consumer Assessment of Healthcare Providers and Systems (CAHPS) family of surveys.10 While some studies have shown that patient experience responses independently predict other clinical outcomes, such as mortality and readmission rates, it is quite possible for a hospital to score poorly on clinical outcome measures and well on patient experience measures.11 However, this does not totally negate the utility of patient experience information since most believe it is important in its own right: A poor patient experience is per se a valid outcome of care.
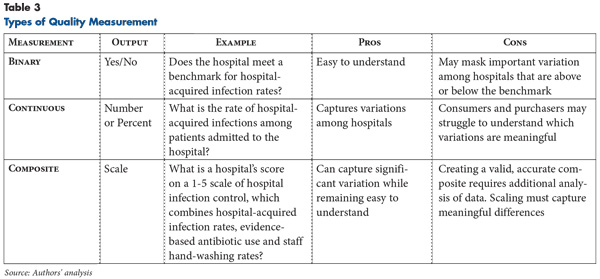
Developers also decide on the most consistent and meaningful way for hospitals to report quality information. For example, an assessment of a hospital’s infection control practices could be documented as:
- categorical or binary information—for example, whether or not annual hospital-acquired infection rates remained under a particular benchmark;
- continuous—for example, reporting the actual rate of hospital-acquired infections; or
- composite information—for example, ranking hospitals on a scale of 1-5, incorporating infection rates and other infection control processes and outcomes.
Each of these measurement choices affects ease of reporting as well as ease of interpretation by the end user (see Table 3 for more about types of quality measurement).
Unsurprisingly, given these challenges, some diseases have many quality measures using a range of approaches to evaluate care, while others have few. For example, the care of patients hospitalized for a cardiac catheterization, or percutaneous coronary intervention (PCI), can be evaluated by outcome measures like mortality or readmission after the procedure as well as process measures—for example, whether the PCI was performed within 90 minutes of arrival—and efficiency—the total costs of the patient’s care. In contrast, relatively few quality measures evaluate inpatient hospitalizations for psychiatric illness; those that do emphasize processes of care, such as the number of hours patients are in seclusion or the presence of a follow-up care plan.
Challenges to Meaningful Measurement
Measure development can raise difficult and controversial questions, particularly as developers advance beyond the so-called low-hanging fruit to capture important dimensions of quality where the evidence base supporting particular approaches is less robust. Poorly designed or prematurely implemented measures may have serious unintended consequences. For example, a measure aimed at promoting timely administration of antibiotics to emergency department patients with pneumonia was criticized as encouraging physicians to prescribe antibiotics too liberally without a confirmed diagnosis. Physician specialty societies have protested vigorously against measures they view as unfair or ill conceived, sometimes causing implementation of the measure to be delayed or withdrawn.12
The National Quality Forum (NQF), an independent organization funded by public and private entities, endorses measures with a kind of Good Housekeeping Seal of Approval attesting to a measure’s importance, validity and feasibility. NQF-endorsed measures, which usually undergo review by a panel of stakeholders and other experts, are much more likely to be adopted, especially by the Centers for Medicare and Medicaid Services (CMS). However, there are many important aspects of clinical medicine—for example, how effectively providers work together to coordinate care—that cannot be measured with the same ease and precision as more traditional clinical outcomes, such as blood pressure or weight. In these areas, where the relevant data are limited or difficult to gather, developing quality measures is particularly difficult. As a result, relatively few NQF-endorsed measures address effective communication and care coordination, which patients may find more relevant than measures of more obscure aspects of clinical performance.
Measure Maintenance and Certification
Once a measure is developed, it must be maintained and updated—or sometimes removed—by a measure steward organization that serves as a contact point for stakeholder concerns. Stewards are typically, though not always, the same organization that developed the measure. In some cases, quality measures lose relevance or validity because of changes in medical evidence or providers reaching such high levels of compliance that further measurement would no longer help distinguish meaningful differences in quality among providers.
For example, the CMS Hospital Inpatient Value-Based Purchasing program eliminated a number of measures with high overall hospital compliance or small variation in performance, such as measures evaluating whether aspirin was provided upon hospital arrival for patients experiencing a heart attack and whether smoking cessation counseling was provided for heart attack, heart failure and pneumonia patients.13
Health Information Technology and Quality Measurement
Growing provider adoption of electronic health records, catalyzed by creation of the Medicare and Medicaid EHR Incentive Programs for Meaningful Use, may encourage and enable more advanced approaches to capturing and reporting quality performance data. Clinical data from EHRs can sharpen the focus of existing quality measures to further distinguish meaningful differences in performance, as well as add new dimensions of quality previously not captured. For example, electronic health records can capture not only processes of care—was an antihypertensive medication prescribed—but also outcomes—did the patient’s blood pressure subsequently go down—that are not in claims data and would otherwise require manual chart audits.14 Clinical data stored in EHRs, such as hemoglobin A1c values or body-mass index, can indicate not only whether a patient has a particular clinical condition, but also in many cases the severity of the condition, allowing risk adjustment that better accounts for the needs of patients with multiple complex illnesses.
EHRs can capture dimensions of quality that are not well measured in claims, such as care transitions—for example, whether a patient’s primary care provider received a hospital discharge summary in a timely manner—and patient-reported outcomes, such as self-reported pain levels as entered via a patient portal. Patients’ self-assessment is of particular importance to purchasers because conditions such as chronic pain affect ability to work and productivity. These types of measurement will become more feasible as providers become better integrated via shared electronic records and as more information is recorded in structured fields that can be easily retrieved and interpreted rather than as free text. However, few measures have as yet been developed to use EHR clinical data in a way that ensures their accuracy and reliability across EHR platforms.
Key Elements of an Active Purchasing Strategy
Purchasers generally use quality information to pursue active purchasing strategies seeeking higher quality at an equal or lower cost. Different approaches to active purchasing may be necessary, however, depending on the specific attributes of a purchaser’s enrollee population. Key steps in developing an active purchasing strategy include:
- understanding the enrollee base and current patterns of health care use;
- making sense of quality reports;
- assessing market and provider characteristics; and
- communicating quality information to enrollees and providers.
Understanding the Enrollee Base
The characteristics of an employer’s enrollee base shape health care expenditures. For example, an employer with predominantly young employees engaged in factory work might see very different patterns of service use than an employer whose workers typically are older workers with desk jobs. The extent to which coverage extends to spouses and children also shapes the nature and variability of health care utilization and spending. Analysis of claims over time may reveal that a relatively small group of enrollees or services accounts for a disproportionate share of costs or may show that costs are fairly evenly distributed.
This information can guide the development of active purchasing strategies. Some strategies will apply across all purchasers—for example, eliminating spending on avoidable patient safety failures, such as hospital-acquired infections. However, purchasers with skewed costs because of enrollees’ use of specific high-cost or high-volume service lines may wish to pursue more targeted approaches. Some types of services—for example, cardiac surgery and orthopedic procedures—may be quite amenable to active purchasing, with an extensive evidence base that has been incorporated into NQF-endorsed quality measures or where the performance of high-cost elements, such as implantable orthopedic devices, can be compared. In other cases—for example, pediatric psychiatry—there may be far less evidence to guide care. In the latter case, purchasers may be limited in their ability to increase value.
Making Sense of Quality Reports
Quality measurements are often aggregated into report cards or other summaries that seek to combine multiple views of quality into a single, easy-to-interpret picture. Typically, a purchaser would rely on one of the many report cards available that summarize elements of providers’ performance across their entire patient population. However, few, if any, report cards completely and accurately describe all elements of care. For all but the largest employers, their own claims volume will be insufficient to accurately judge the quality of providers in their area. These reports, which are developed at the level of individual communities, states and the nation as a whole, not only assemble a hospital’s performance data from relevant quality indicators, but also frequently grade providers’ overall performance using external benchmarks.
Hospital Compare, developed by CMS, is the major source of publicly reported hospital quality information: Most hospitals report information on a set of core measures to CMS to avoid Medicare payment penalties. Dozens of smaller interactive reporting sites present data derived from the Hospital Compare site, but narrow it by geography or clinical service area. Other quality transparency efforts developed by state and national private organizations distinguish themselves by aggregating and presenting data from multiple reporting initiatives. For example, The Commonwealth Fund’s national Why Not The Best program uses Hospital Compare data, including CAHPS hospital patient satisfaction surveys, state departments of health surveillance information, and data from the Agency for Healthcare Research and Quality’s patient safety and quality indicators.
Private payers also are entering the quality reporting arena, collecting hospital information to be used for quality and outcomes-based incentive programs. For example, Blue Cross Blue Shield of Michigan’s Collaborative Quality Initiative provides hospitals with data forms to be completed for participation in a hospital pay-for-performance program. These efforts represent an important step toward tying payment to outcomes and rewarding high-performing hospitals. Because health plans have not developed a common approach to quality reporting, however, the multiple, overlapping reporting requirements that have resulted can be burdensome to hospitals.
The presentation of publicly available performance data is critical to help users interpret information and distinguish meaningful differences among hospitals. Summary rankings, the use of categories or benchmarks, and identification of statistical outliers all help contextualize performance but provide different levels and types of information. Quality reports should present information that is clear and accessible to users, while allowing them to understand meaningful distinctions between providers. Information can be clearly presented but not meaningful, or necessary information can be presented in a way that diminishes its value.
For example, the national Hospital Compare website is built on detailed records of hospital performance on a wide range of endorsed quality measures. However, the report lumps the vast majority of providers into a single category and separates out only the highest- and lowest-performing 2.5 percent of hospitals, which likely obscures meaningful differences among the middle 95 percent. In contrast, sites such as U.S. News and World Reports score and then rank hospitals within various service lines. While rankings allow users to distinguish among individual hospitals, these rankings are based on an opaque combination of data, the accuracy and validity of which is difficult to assess. These approaches do not indicate what ranking or rating is “good enough” to offer an acceptable level of care and what magnitude of difference between hospitals is meaningful. Ideally, quality measurement initiatives can strike a balance between meaningful detail and ease of interpretation. The CalHospitalCompare website, for example, uses benchmarks based on national performance levels to create an objective five-point scale rating, allowing meaningful and easily interpretable categorizations of hospitals as high or low performers.15
Assessing Market and Provider Characteristics
Measuring quality of care is necessary but insufficient to guide an active purchasing strategy.16 Given the dearth of demonstrable improvements in outcomes and costs for programs that steer enrollees based on quality alone, organizations must also consider price. Upon review of cost and quality information, through payer data or publicly available report cards, purchasers may find that many local hospitals are in fact providing high-quality care to their enrollees, but that because costs are high compared with other, similar markets it is not high-value care. If costs and quality for a particular service are both uniformly high across a market, purchasers may seek to encourage price competition by steering enrollees toward providers that discount their services. While such a strategy is similar to centers of excellence strategies that involve the selection of high-quality providers, it is less about distinguishing the highest-quality providers and more about using reasonably high quality as a threshold above which price is the predominant concern.
If quality is generally high and prices vary within a market, purchasers might consider a reference pricing strategy—for example, setting a reasonable fixed payment that would allow patients a choice of high-quality hospitals that offer the service at or below the threshold and making enrollees responsible for any additional costs.
If the costs and quality of care both vary, purchasers can designate a few centers of excellence that offer the highest-quality care for certain procedures as opposed to setting only a minimum threshold that many hospitals in a market can achieve. Purchasers can restrict their networks for the procedures to these few centers, with the expectation that the hospitals will offer lower prices in exchange for markedly higher volumes. Tiered networks offer a similar approach by sorting providers that meet a quality threshold into tiers based on price. To encourage patients to use lower-cost hospitals, cost sharing would be lower.
If the care in a community for a particular service line is of uniformly poor quality, purchasers may need to expand their provider network beyond their local market to include regional, national or even international alternatives. This strategy also may be appealing in high-cost markets where local providers are unwilling to engage in price competition. Several large corporations have developed these types of programs for selected services.17 Because this approach generally entails covering travel costs for enrollees and their companions and negotiating a transition to local follow-up care, substantial savings on the health care services themselves are necessary for it to succeed.
Purchasers must understand the relative strength of providers in their local market. Hospitals with substantial leverage in negotiations may seek to circumvent active purchasing strategies altogether, for example, by refusing to participate in a plan’s provider network if they are excluded for any individual service.
Communicating Quality Information to Enrollees and Providers
Purchasers often provide quality information directly to enrollees to use when seeking care. If patients are aware of hospital quality and cost variation in their community, they can, in theory, make more informed decisions about where to get care. The impact of providing information alone, as opposed to information delivered along with cost-sharing incentives, is unclear. Several studies have found evidence that the release of public quality report cards does shift patient volume toward higher-rated providers.18 Yet, other research shows that consumers tend not to use publicly available quality information, typically because existing quality information is difficult to understand or fails to emphasize consumers’ preferred dimensions of quality.19 Providers are sometimes given different quality designations by different sources,20 which may add to patients’ confusion and skepticism. In general, public quality reporting likely has been more effective as a spur to providers to improve performance than as a source of actionable consumer information.
Purchasers Can Promote Effective Quality Reporting
Large employers can use their influence to promote improvements to the quality measurement and reporting process by improving the validity and usefulness of performance data. Individual purchasers or coalitions can adopt the best available report cards, develop better ones themselves, or create standards for the reporting systems used by payers and other organizations. For example, encouraging greater harmonization of reporting requirements across quality measurement programs can ease providers’ data-gathering burden while allowing more effective comparisons among providers. Other key steps for the purchaser community to consider include:
- supporting the development of quality report cards with benchmarks that meaningfully distinguish among providers;
- promoting consistency in quality designations among different payers and value-based purchasing programs;
- developing more personalized, accessible information for enrollees explaining what clinical quality means to them and ensuring that quality designations are transparent to enrollees—for example, by explaining the relative roles quality and price each play in determining a designation; and
- collaborating with other large purchasers—through organizations such as the Leapfrog Group or regional business groups—to identify untapped areas of quality measurement important to purchasers and what data or measure development may be necessary to assess these areas.
Key Takeaways for Purchasers
Purchasers need to consider both quality and cost in creating an active purchasing strategy, particularly given the lack of a clear link between higher performance on process measures and improved outcomes that lead to lower health care costs. Purchasers also should consider quality metrics that include measures of patient experience and cover both overall indicators and service-line specific measures relevant to their covered population’s cost and utilization.
Active purchasing strategies should be shaped by local market dynamics: High-quality, high-cost markets with so-called must-have providers require a different approach than markets with more competition and variable cost and quality. The gold standard of quality measurement continues to evolve. Active purchasing strategies should remain flexible to newly developed techniques and indicators, especially as EHR adoption accelerates and provides new ways to capture quality information.
Correction: This Policy Analysis incorrectly reported that CalHospitalCompare was no longer operational. We regret the error, and all online documents were updated to reflect the correction on April 25, 2013.
Notes
1. Corrigan, Janet M., Molla S. Donaldson and Linda T. Kohn, editors, Crossing the Quality Chasm: A New Health System for the 21st Century, National Academy Press, Washington, D.C. (2001).
2. For example, introducing a surgical checklist to reduce peri-operative mortality and interventions to address central line-associated bloodstream infections and ventilator-associated pneumonias in intensive care units across the United States. See Haynes, Alex B., et al., “A Surgical Safety Checklist to Reduce Morbidity and Mortality in a Global Population,” New England Journal of Medicine, Vol. 360, No. 5 (January 2009); Berenholtz, Sean M., et al., “Eliminating Catheter-Related Bloodstream Infections in the Intensive Care Unit,” Critical Care Medicine, Vol. 32, No. 10 (October 2004); and Kollef, Marin H., “Prevention of Hospital-Associated Pneumonia and Ventilator-Associated Pneumonia,” Critical Care Medicine, Vol. 32, No. 6 (June 2004).
3. National Quality Forum (NQF), NQF Measure No. 0733, Operative Mortality Stratified by the Five STS-EACTS Mortality Categories and NQF Measure No. 0300, Cardiac Surgery Patients with Controlled Postoperative Blood Glucose, https://www.qualityforum.org/QPS/QPSTool.aspx (accessed on March 21, 2013).
4. Healthcare Association of New York State, Understanding Publicly Reported Hospital Quality Measures: Initial Steps Toward Alignment, Standardization, and Value, Rensselaer, N.Y. (December 2007).
5. Rau, Jordan, “Hospital Ratings Websites,” Kaiser Health News, (March 18, 2013).
6. The Leapfrog Group, The Leapfrog Hospital Survey Reference Book: Supporting Documentation for the 2011 Leapfrog Hospital Survey, Washington, D.C. (Dec. 13, 2011).
7. NQF, NQF Measure No. 0160, Beta-Blocker Prescribed at Discharge for AMI, https://www.qualityforum.org/QPS/QPSTool.aspx (accessed on March 21, 2013).
8. NQF, NQF Measure No. 0069, Appropriate Treatment for Children with Upper Respiratory Infection (URI), https://www.qualityforum.org/QPS/QPSTool.aspx (accessed on March 21, 2013).
9. Birkmeyer, John D., Justin B. Dimick and Nancy J.O. Birkmeyer, “Measuring the Quality of Surgical Care: Structure, Process, or Outcomes?” Journal of the American College of Surgeons, Vol. 198, No. 4 (April 2004).
10. Agency for Healthcare Research and Quality, About CAHPS, http://cahps.ahrq.gov/about.htm (accessed on March 21, 2013).
11. Boulding, William, et al., “Relationship Between Patient Satisfaction with Inpatient Care and Hospital Readmission Within 30 Days,” American Journal of Managed Care, Vol. 17, No. 1 (January 2011).
12. See Wachter, Robert M., et al., “Public Reporting of Antibiotic Timing in Patients with Pneumonia: Lessons from a Flawed Performance Measure,” Annals of Internal Medicine, Vol. 149, No. 1 (July 2008); and Schuur, Jeremiah D., et al., “Assessment of Medicare’s Imaging Efficiency Measure for Emergency Department Patients with Atraumatic Headache,” Annals of Emergency Medicine, Vol. 60, No. 3 (September 2012).
13. Centers for Medicare and Medicaid Services, 42 Code of Federal Regulations Parts 422 and 480, Medicare Program: Hospital Inpatient Value-Based Purchasing Program (Final Rule), Washington, D.C. (May 6, 2011).
14. Persell, Stephen D., et al., “Improving Hypertension Quality Measurement Using EHRs,” Medical Care, Vol. 47, No. 4 (April 2009).
15. Tu, Ha T., and Johanna Lauer, Designing Effective Health Care Quality Transparency Initiatives, Issue Brief No. 126, Center for Studying Health System Change, Washington, D.C. (July 2009).
16. Robinson, James C., and Kimberly MacPherson, “Payers Test Reference Pricing and Centers of Excellence to Steer Patients to Low-Price and High-Quality Providers,” Health Affairs, Vol. 31, No. 9 (September 2012).
17. Ibid.
18. Sinaiko, Anna D., “How Do Quality Information and Cost Affect Patient Choice of Provider in a Tiered Network Setting? Results from a Survey,” Health Services Research, Vol. 46, No. 2 (April 2011).
19. Kaiser Family Foundation, 2008 Update on Consumers’ Views on Patient Safety and Quality, Menlo Park, Calif. (October 2008). In 2008, only about 14% of consumers reported using quality information to make a choice among health care providers. See also Hibbard, Judith H., Jessica Greene and Debbie Daniel, “What Is Quality Anyway? Performance Reports That Clearly Communicate to Consumers the Meaning of Quality of Care,” Medical Care Research and Review, Vol. 67, No. 3 (June 2010); and Sinaiko, Anna D., Diana Eastman and Meredith B. Rosenthal, “How Report Cards on Physicians, Physician Groups, and Hospitals Can Have Greater Impact on Consumer Choices,” Health Affairs, Vol. 31, No. 3 (March 2012).
20. Robinson (2012).