Almost 60 percent of Americans younger than 65 obtain health insurance through an employer, but the proportion is steadily declining, largely because of rising health care costs. The decline in employer coverage has disproportionately affected low-wage workers and those in small firms. Amid concerns that national health reform will hasten the ongoing decline of employer coverage, there have been widely differing estimates of how the law will affect employer decisions to offer coverage. A new national study by University of Minnesota researchers working with the Center for Studying Health System Change (HSC) calculates the economic incentives employers face to offer coverage to active workers before and after reform implementation. The findings indicate establishments employing the vast majority of workers (81%) currently offered insurance will continue to have an economic incentive to offer coverage. Under reform, employer premium contributions remain tax exempt, and two new policies take effect in 2014: a penalty on larger employers that do not offer affordable insurance and premium tax credits for lower-income people to purchase insurance in new state exchanges if they lack access to affordable employer coverage. The economic incentive to offer health benefits—expressed as a per-employee dollar amount—is calculated by combining the effects of the three policies.
Following reform implementation in 2014, workers in large firms, those with a union presence and those in higher-wage industries, such as professional and financial services, will see modest changes in their employers’ economic incentive to offer coverage. However, other workers will face large changes. Primarily because establishments with fewer than 50 full-time workers are exempt from any penalty, many will no longer have as strong an economic incentive to offer coverage. The same is true for low-wage firms because many of their workers will qualify for subsidized, exchange-based plans. However, only about a third of workers in low-wage, small firms with fewer than 50 workers currently are offered health benefits.1
- Health Reform and Employer Coverage
- Doing the Math of Employer Coverage
- A Hypothetical Example
- Incentives to Offer Coverage Remain Strong for Most
- Variation by Firm Size, Industry, Union Presence
- Workforce Characteristics
- Policy Implications
- Notes
- Data Source
- Technical Appendix
Health Reform and Employer Coverage
In 2010, employer-sponsored insurance (ESI) covered 59 percent of the nonelderly U.S. population.2 Many employers voluntarily offer health benefits for a variety of reasons, including worker recruitment and retention and preferential tax treatment. Although employers contribute more than 70 percent of premium costs on average,3 the cost of providing insurance is generally considered a part of workers’ compensation. In other words, workers’ wages would be higher if the cost of insurance were lower. In fact, a major reason for stagnant wage growth in recent years is the rising cost of health insurance.4
The preferential tax treatment of both employer and employee premium contributions provides a strong economic incentive to employers to offer coverage, particularly larger, higher-wage firms. With full implementation of the Patient Protection and Affordable Care Act (P.L. 111-148) in 2014, the economic incentives for employers to offer health insurance to active workers will change.
Starting in 2014, the law will provide premium tax credits to people with family incomes between 100 percent and 400 percent of the federal poverty level to purchase nongroup health insurance in the exchanges. At the same time, the law seeks to maintain the primacy of employer-sponsored insurance by including provisions to encourage employers to offer and workers to accept an offer of affordable coverage. Under the law, all employers with 50 or more full-time-equivalent workers will face an annual penalty regardless of whether they offer coverage if one of their full-time employees obtains subsidized coverage in a health insurance exchange. Workers in firms that offer health insurance will be ineligible for subsidized exchange coverage unless the employer coverage is deemed unaffordable—defined as the out-of-pocket premium for employee (single) coverage exceeding 9.5 percent of family income or the plan paying, on average, less than 60 percent of the cost of covered services—a calculation known as the actuarial value.5
Moreover, the employer penalty—also known as the shared-responsibility requirement—differs depending on whether a firm offers coverage. Firms that don’t offer health insurance will face a $2,000 fine for each full-time employee—excluding the first 30 workers—even if only one full-time worker receives subsidized coverage in an exchange. Firms that offer coverage face penalties if the coverage is considered unaffordable to workers as previously defined. If a full-time worker in a firm offering coverage obtains subsidized coverage, the employer will face a penalty of the lesser of $3,000 for each full-time subsidized worker or $2,000 for each full-time employee, excluding the first 30 workers.
Additionally, employees in firms that drop insurance will lose the value of the tax exclusion of the employer’s premium contribution, and workers with so-called cafeteria plans that allow them to pay their premium share through tax-exempt salary deductions will lose that tax advantage.6
This research brief summarizes key findings from an analysis that estimates the direct economic incentive of offering ESI among private-sector U.S. employers (see Data Source).7 While other studies have used micro-simulation models to estimate the response of employers with respect to offering ESI to active workers following reform implementation, this analysis focuses on the intermediate outcome of changes in the magnitude of economic incentives facing employers and employees. Specifically, the economic incentive to offer ESI includes the costs and benefits of offering coverage. Moreover, an employer’s decision to offer health insurance will depend on workers’ valuation of health insurance relative to wages. One would expect this valuation to vary by characteristics of an establishment’s workforce, including its workers’ wages and family incomes, family size, demographics, and federal and state tax rates—given the exclusion of premiums from individual income taxes.8
The economic incentive or disincentive is calculated by adding the dollar value of the ESI tax subsidy and the value of avoiding the penalty for not offering insurance, and then subtracting the value of the premium tax credits that eligible workers could use in an exchange if their employer does not offer coverage.9 Behind the analysis is the assumption that employers act as their employees’ agents and consider what is in workers’ best economic interest when deciding to offer health insurance.10
A positive dollar value suggests a stronger economic incentive for an establishment to offer insurance, while a negative value suggests an economic disincentive. How employers interpret or act on their economic incentives is another matter. Some establishments with positive values, nevertheless, do not offer health insurance, and some with negative values do offer insurance. This may be because of other economic or noneconomic factors playing a role in the decision or because employers cannot accurately calculate the advantage for their workers—for example, not knowing workers’ family incomes.
Additionally, the estimates of economic incentives may be imprecise. But, results from this analysis can inform policy makers regarding how the health reform law will change the calculus of employer decisions to offer ESI and how these changes vary by firm size, industry and workforce attributes of private-sector U.S. employers.
Doing the Math of Employer Coverage
As previously outlined, the economic incentive or disincentive to offer coverage is calculated by adding the dollar value of the ESI tax subsidy and the value of avoiding the penalty for not offering insurance, and then subtracting the value of the premium tax credits that eligible workers could use in an exchange if their employer does not offer affordable coverage.
Value of the tax subsidy for employer-sponsored insurance. The value of the tax subsidy depends on the tax-exempt portion of the premium and the tax rates of workers at the establishment. For each establishment, the study identified the relevant amount of the premium that is currently tax exempt. Premiums were imputed for establishments that do not currently offer ESI by using average premiums among establishments of similar size, industry and state.11 This is either the employer-paid portion of the premium or the total premium for an establishment with a Section 125 plan. The amount was calculated for workers enrolled in three coverage types—single, employee plus one and family—and inflated to 2014 dollars. Then using estimates of workers’ average tax rates at each establishment, the value of the tax subsidy was computed.
Value of the penalty. If an employer with at least 50 full-time workers does not offer insurance and any full-time employee receives a premium tax credit when purchasing individual insurance in an exchange, the employer will be assessed a penalty equal to $2,000 times the number of full-time employees at the firm less 30.12
Value of the exchange subsidies. In 2014, premium tax credits will be available to lower-income people who lack an offer of affordable ESI to purchase individual insurance on a sliding scale in newly created exchanges.13 The subsidy equals the premium of the second-lowest cost &dlquo;silver plan,&drquo; which has an actuarial value of 70 percent, less a percentage of the family’s income. Families with higher incomes pay a higher percentage. The Congressional Budget Office estimated that the premium of a silver plan will be $5,300 for single coverage and $15,000 for family coverage in 2016 ($4,762 and $13,476 in 2014 dollars).14
A Hypothetical Example
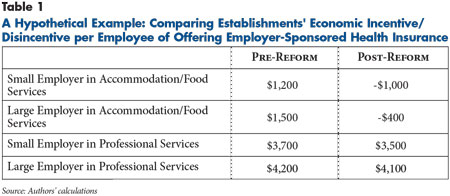
Before 2014, the direct economic incentive to offer ESI is the value of the tax subsidy. In 2014, the economic incentive is the value of the tax subsidy plus the value of the avoided employer penalty minus the value of the exchange subsidies potentially claimed by workers. The economic incentive per employee is measured in dollars and depends on the size of the establishment—whether it is subject to the penalty. The economic incentive to offer ESI can differ widely across establishments as illustrated by a hypothetical example focusing on two small employers—fewer than 50 full-time workers—and two large employers that currently offer ESI (see Table 1). Two of these employers—one large and one small—are in the food services industry, while the other two provide professional services.
Before 2014, the small and large employers in professional services have a larger economic incentive ($3,700 and $4,200, respectively) relative to those in food services ($1,200 and $1,500, respectively). This difference is explained by the fact that workers in professional services generally have higher incomes and more comprehensive and expensive health coverage than those in the food services industry. These factors both increase the value of the ESI tax subsidy.
In 2014, the economic incentive to offer ESI also includes the value of the avoided penalty minus the exchange subsidies that some of an establishment’s workers could obtain if it dropped insurance. In this example, the two small employers are exempt from the penalty. Therefore, the value of the exchange subsidies is the key factor in the change in their economic incentive to offer coverage.
Compared with the small employer in professional services, the small establishment in food services is more likely to have a larger number of workers eligible for exchange subsidies if the employer drops insurance, leading to a sizeable change in the economic incentive to offer ESI from $1,200 to a disincentive of -$1,000. In contrast, the small professional firm experiences only a slight reduction from $3,700 to $3,500. The pattern is similar for the large establishments, with the one in the food services industry moving from $1,500 to -$400, largely because the value of the tax exemption and exchange subsidies is partially offset by the penalty cost if it dropped ESI. Likewise, the large establishment in professional services experiences a slight decrease from $4,200 to $4,100.
Incentives to Offer Coverage Remain Strong for Most
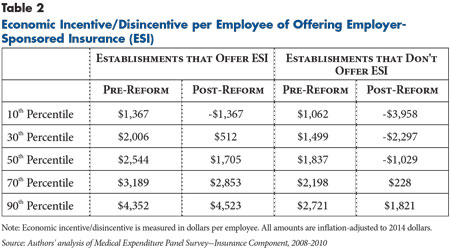
Before health reform implementation in 2014, the 50th percentile or median value of the economic incentive for workers in U.S. private-sector establishments that offer ESI is $2,544 per employee (see Table 2). However, there is substantial variation. Currently, 10 percent of workers with an ESI offer are in establishments with an incentive of $1,367 or less, while 10 percent of workers are in establishments with an incentive of $4,352 or more. As expected, the distribution for workers in establishments that do not currently offer ESI is substantially lower. Pre-reform, the median value of the economic incentive to offer coverage for these workers is $1,837.
After health reform implementation, establishments employing 81 percent of workers currently offered insurance will continue to have an economic incentive to offer coverage. About two-thirds of workers in establishments that do not now offer ESI will shift from having an economic incentive to a disincentive to offer coverage.
Variation by Firm Size, Industry, Union Presence
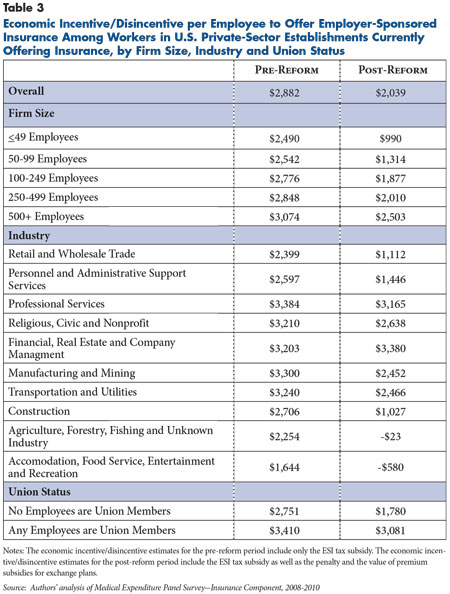
In the pre-reform period, the economic incentives of employers to offer ESI are all positive and increase with firm size (see Table 3). In 2014, the largest firms continue to have a strong economic incentive, with an average incentive of $2,503 per employee. However, the smallest firms will face lower economic incentives—$990 on average—in the post-reform period, in large part because these employers will be exempt from the penalty.
The economic incentive also varies by industry. In the pre-reform period, establishments in professional services and manufacturing and mining have the highest incentive per employee—$3,384 and $3,300, respectively—while those in accommodation, food services, entertainment and recreation have the lowest—$1,644. This pattern reflects industry differences in earnings and thus employees’ tax rates.
Following reform implementation, the economic incentive to offer ESI remains positive for workers in many industries. The exceptions are workers in accommodation, food services, entertainment and recreation; as well as agriculture, forestry, fishing and unknown industries (-$23 and -$580, respectively), because of the greater eligibility of these workers for exchange subsidies.
Workers in establishments with a union presence will continue to have a large economic incentive to offer coverage—$3,081—after 2014. The change for these workers is considerably smaller than for workers in other establishments. The primary reason is the greater eligibility for exchange subsidies among workers in establishments without a union presence, given lower average family incomes.
Workforce Characteristics
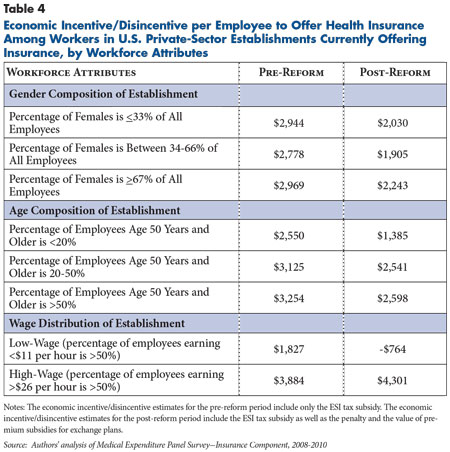
There is a strong relation between the wage distribution of an establishment’s workers and the economic incentive to offer health insurance (see Table 4). Among workers in low-wage establishments that currently offer ESI, the economic incentive shifts from $1,827 to -$764 following initiation of premium tax credits for individuals to purchase exchange-based insurance.
In contrast, the economic incentive for establishments with high-wage workers to offer ESI actually increases in the post-reform period from $3,884 to $4,301 on average because few of these workers would qualify for exchange subsidies and dropping insurance would trigger an employer penalty.
Policy Implications
The Patient Protection and Affordable Care Act includes provisions that will affect employer decisions about offering health insurance. This study examined two of the most important and quantified how the economic incentive to offer ESI may change as a result of reform implementation in 2014. While the results suggest that the economic incentive to offer ESI will weaken for small and low-wage establishments, the findings indicate that establishments employing the vast majority of workers who currently are offered ESI will continue to have an economic incentive to offer health benefits.
While the three components of calculating the economic incentive to offer coverage capture important factors that influence employers’ decisions, they do not capture all possible factors. For example, an employer may choose to offer ESI to attract and retain workers in labor markets with low rates of unemployment, or it might place more weight on the preferences of key, higher-wage workers relative to the average worker considered in this analysis. Alternatively, an employer’s decision to not offer ESI may reflect that its workers simply prefer more taxable income over tax-free health insurance irrespective of any economic advantages.
It is also important to note that the study implicitly weights each of the three components equally in dollars. It is unknown whether an employer actually assigns equal weight to the value of the tax subsidy, the value of the penalty for not offering insurance and the value of the exchange subsidies. After 2014, for example, the penalty will be transparent, and its financial effects will be felt immediately by larger employers that do not offer ESI and have at least one full-time worker who obtains subsidized coverage in an exchange. In contrast, employers may be much less certain about the potential eligibility of their workers for exchange subsidies, because they lack information about whether workers’ spouses have access to ESI or whether the family incomes of their workers would make them eligible for premium tax credits.15
While most nonelderly Americans with health insurance obtain their coverage through an employer, access to employer-sponsored insurance has been declining over the past decade, especially among workers in small, low-wage firms. Throughout the health care reform debate, an important policy goal of the Obama administration and Congressional leadership was to preserve and strengthen private health insurance markets.
Many provisions in the law are intended to ensure that ESI will remain intact following the implementation of exchanges and the availability of premium tax credits for lower-income people without access to affordable employer coverage in 2014. Notably, the shared-responsibility requirement discourages large employers&&151;the vast majority of which currently offer insurance—from dropping coverage and sending workers and dependents to exchanges to purchase nongroup coverage. The law also creates a firewall of sorts between ESI and subsidized exchange-based insurance by making workers with affordable offers of ESI ineligible to receive premium tax credits. This provision limits employers’ ability to encourage their sickest and most-expensive workers to turn down ESI and buy an exchange-based plan.
Policy makers’ decision to continue the preferential tax treatment of ESI premiums in the immediate term represents another step toward preserving ESI. Rather, the law includes an excise tax—often called the Cadillac tax— in 2018 on insurers and self-insured employers that have premiums in excess of $10,200 for single coverage and $27,500 for family coverage. While the excise tax—which is more likely to affect firms with higher-wage workers offering more generous coverage—will decrease the economic incentive to offer coverage, it’s unlikely to prompt many affected employers to stop offering coverage. Instead of dropping coverage, firms are more likely to modify benefit designs to bring their premiums under the threshold.16
Other reform provisions aim to improve access to affordable coverage for workers in small firms. Between 2010 and 2013, small employers with 25 or fewer workers and average annual wages of less than $50,000 are eligible for a tax credit of up to 35 percent of the employer’s premium contribution if the employer contributes at least half of the total premium or a benchmark premium. In 2014, the potential size of the tax credit increases, but the credit will only be available for two years.
Perhaps most relevant to ESI are provisions that focus on exchanges. Beginning in 2014, exchanges will provide more organized marketplaces for small employers and individuals to purchase coverage under a strengthened regulatory environment—for example, modified community rating, guaranteed issue, premium rate review and medical-loss ratio requirements. Many policy makers and analysts expect these changes will reduce insurance-related administrative costs, increase plan choice and generate stronger price competition among plans—factors that lead to better value for small employers and their workers. But if this marketplace achieves the envisioned success, it will ease the path for employers deciding to stop offering coverage, with their employees faring much better than they would in today’s individual insurance market.
Notes
1. Agency for Healthcare Research and Quality, Medical Expenditure Panel Survey—Insurance Component, Summary Table I.B.2 (2010). Accessed at: http://meps.ahrq.gov/mepsweb/data_stats/summ_tables/insr/national/series_1/2010/tib2.pdf.
2. DeNavas-Walt, Carmen, Bernadette D. Proctor and Jessica C. Smith, Income, Poverty, and Health Insurance Coverage in the United States: 2010, U.S. Census Bureau, Washington, D.C. (September 2011).
3. Kaiser Family Foundation, Menlo Park, Calif., and Health Research & Educational Trust, Chicago, Ill., Employer Health Benefits 2012 Annual Survey (September 2012).
4. Executive Office of the President, Council of Economic Advisers, The Economic Case for Health Reform, Washington, D.C. (June 2009).
5. For analysis of this provision, see Burkhauser, Richard V., Sean Lyons and Kosali Simon, An Offer You Can’t Refuse: Estimating the Coverage Effects of the 2010 Affordable Care Act, Employment Policies Institute, Washington, D.C. (July 2011).
6. This refers to a so-called cafeteria benefit plan that complies with Section 125 of the Internal Revenue Code. A Section 125 plan allows eligible employees to choose among two or more benefits consisting of salary, taxable and non-taxable benefits. When selecting health insurance, employees make premium contributions through pre-tax payroll deduction. For more information, see Internal Revenue Service, Employer’s Tax Guide to Fringe Benefits, Washington, D.C. (Dec. 7, 2011).
7. This analysis does not include employer-sponsored coverage for those who have retired. The decisions with respect to retiree coverage are distinct from those concerning coverage for active workers and are much more complex, involving perspectives of current employees of the value to continuing at the employer until they are eligible for retirement and follow through on commitments for retiree coverage made in the past. Employers do not face penalties for not covering retired workers, who may be eligible for larger premium credits than active workers because of lower incomes.
8. All tax rates (federal, state, OASDI, and marginal payroll tax rates for Medicare Hospital Insurance) were estimated in the MEPS-HC using TAXSIM. For a description of TAXSIM, see Feenberg, Daniel, and Elisabeth Coutts, &dlquo;An Introduction to the TAXSIM Model,&drquo; Journal of Policy Analysis and Management, Vol. 12, No. 1 (1993).
9. The law also provides for cost-sharing subsidies for individuals with incomes up to 250 percent of poverty who obtain coverage in the exchanges. The impact of the cost-sharing subsidies for this group is not included in the calculation of economic incentives to offer coverage because it will depend on health status and other factors not easily quantifiable. The exclusion of the cost-sharing subsidies in the calculation means that the economic incentive to offer coverage by employers with many lower-wage workers is likely overstated.
10. Empirical studies of this assumption include Moran, John R., Michael E. Chernew and Richard A. Hirth, &dlquo;Preference Diversity and the Breadth of Employee Health Insurance Options,&drquo; Health Services Research, Vol. 36, No. 5 (October 2001); and Bundorf, M. Kate, &dlquo;Employee Demand for Health Insurance and Employer Health Plan Choices,&drquo; Journal of Health Economics, Vol. 21, No. 1 (2002). These results on tailoring the mix of health insurance and other compensation according to worker preferences relate to long-run relationships and do not preclude short-run behavior that is different. For example, short-term rigidities or imperfections in labor markets could result in situations where the reduction in an employer’s health care costs because of workers being shifted to the exchanges may not be fully offset by an increase in the workers’ wages.
11. If premiums for nonoffering firms would be higher because of other factors not controlled for, the economic incentive may be underestimated for workers in nonoffering establishments.
12. It is possible to estimate the firm’s penalty using information on firm size available in the MEPS-IC. Because the unit of analysis is an establishment, the firm’s penalty is apportioned to the establishment based on the proportion of the firm’s workers that are employed at that establishment. This method implicitly assumes that the establishment’s distribution of full- and part-time workers is comparable to that of the firm.
13. An employee may be eligible for a premium tax credit only if he or she does not have access to any source of ESI within his or her family. Very low income individuals will also be eligible for subsidies to reduce out-of-pocket cost sharing associated with exchange-based plans. The value of these subsidies is not included in the economic incentive calculation.
14. Congressional Budget Office (CBO), Selected CBO Publications Related to Health Care Legislation, 2009-2010, Washington, D.C. (December 2010). These values represent a national average. In 2014, it is expected that exchange-based premiums will vary geographically in ways that may also be correlated with wage rates and other inputs to the production of medical care.
15. Economists assume that in the medium to long run, employees pay the penalty amount through lower wages or slower wage growth.
16. In a few cases where a firm has very high premiums because of its geographic location and the age of its workers despite relatively low wages, the Cadillac tax could have some influence on the decision to offer coverage.
Data Source
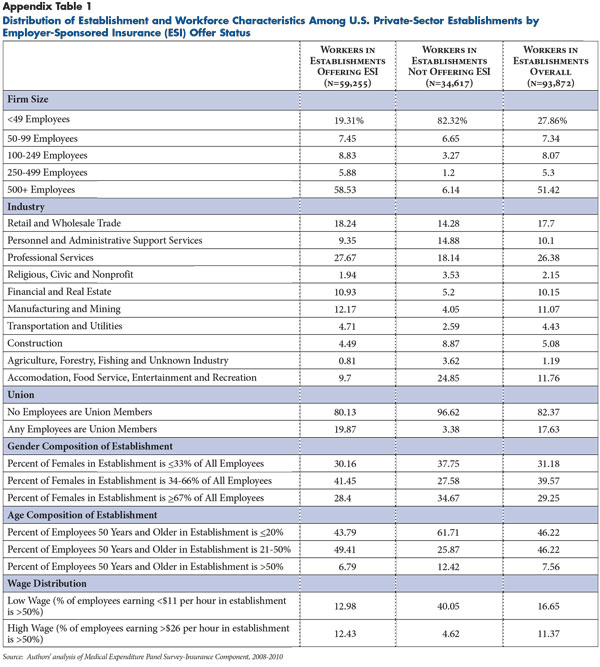
The primary data source is the Agency for Healthcare Research and Quality’s Medical Expenditure Panel Survey-Insurance Component (MEPS-IC) for 2008, 2009 and 2010. The MEPS-IC is a nationally representative, establishment-level survey of U.S. employers that collects detailed information on the provision of health insurance. The MEPS-IC data are not available in the public domain. The research team obtained approval from the U.S. Bureau of the Census to conduct this study, and all analyses were conducted at the Minnesota Census Research Data Center. Any opinions or conclusions expressed herein are those of the author(s) and do not necessarily represent the views of the U.S. Census Bureau. All results have been reviewed to ensure that no confidential information is disclosed. The MEPS includes questions about an employer’s workforce (e.g., age, gender, wage distribution and union presence) and characteristics of the establishment (e.g., firm size, industry and state). An establishment is an economic unit that produces goods or services at a single location typically. In contrast, a firm is a legal business that may have one or more establishments. Information also is collected from employers that offer insurance about the plan(s) they offer, including the total premium, employer and employee contributions, enrollment by coverage type (single, employee plus one and family), and Section 125 status. Since the MEPS-IC does not contain information on workers’ family income, size and other factors to estimate the value of the tax subsidies and exchange subsidies, researchers used a statistical matching method to impute these additional characteristics of workers and their families to establishments in the MEPS-IC. The source for the additional data is the MEPS-Household Component, a nationally representative sample of the noninstitutionalized U.S. population. Additional detail on the data and methods is presented in the Technical Appendix. For descriptive statistics of the MEPS-IC sample, see Appendix Table 1.
About the Authors
Jean M. Abraham, Ph.D., is an associate professor in the Division of Health Policy and Management at the University of Minnesota; Peter Graven, M.S., is a research economist at the Center for Health Systems Effectiveness at Oregon Health and Science University; and Roger Feldman, Ph.D., is the Blue Cross Professor of Health Insurance in the Division of Health Policy and Management at the University of Minnesota.
Technical Appendix
The economic incentive of offering employer-sponsored insurance (ESI) in 2014 is calculated by adding the value of the tax subsidy of ESI premiums to the value of the employer shared-responsibility requirement associated with not offering coverage, and then subtracting the value of premium tax credits (exchange subsidies) that an establishment’s workers could obtain in an exchange if the employer does not offer ESI. This economic incentive of offering ESI is measured in dollars per employee and inflation-adjusted to 2014 dollars. Positive values suggest stronger economic incentives to offer coverage, while negative values suggest an economic disincentive to offer. Because other economic and non-economic factors may influence an employer’s decision to offer ESI, it is important to remember that a positive value does not necessarily imply that an employer will offer ESI or that a negative value necessarily implies an employer will not offer coverage.
Data: The primary data source is the Insurance Component (IC) List Sample of the Medical Expenditure Panel Survey (MEPS) for 2008, 2009 and 2010. The MEPS-IC is an annual, nationally representative, establishment-level survey of private-sector employers, as well as state and local governments. The survey collects detailed information on offers of coverage as well as plan attributes (premiums, employer and employee shares, enrollment by coverage type, benefit design) for establishments that offer insurance. Additionally, the MEPS-IC collects data on workforce characteristics (percent of workers age 50 and older; percent of workers who are female; percent of workers in low-, medium-, and high-wage categories, percent of workers that are union members); and establishment characteristics, including establishment size, industry, years in business, number of locations, ownership, firm size and geographic location for all observations.
The analysis is limited to private-sector U.S. employers and excludes state and local government organizations. In building the analytic file, observations were used from establishments that offer ESI and those that do not.
The study also used the MEPS Household Component (HC) Full-Year Consolidated files for 2007 and 2008 (the two most recent years available at the time the research proposal was presented to the U.S. Census Bureau). The HC is an annual, nationally representative sample of the non-institutionalized U.S. population. It contains detailed information on individuals within households, including their demographic characteristics, employment attributes and health insurance status.
MEPS-IC variable construction: For the analysis, we constructed and/or used a large number of variables from the MEPS-IC database, including establishment size categories (1-49; 50-99; 100-249; 250-499; 500 plus), firm size categories (1-49; 50-99; 100-249; 250-499; 500 plus), an indicator for more than one location, business tenure (< 1 year, 1-4 years, 5-9 years, 10 or more years), an indicator for nonprofit ownership, a set of indicators for industry, the percentage of workers at an establishment that are part time, the percentage of workers at an establishment that are female, the percentage of workers at an establishment that are age 50 years or older, the percentage of workers at an establishment that are union members, and the percentage of workers at an establishment by wage category (low, medium, high). To address item non-response issues for some of the workforce and establishment measures, we used multiple imputation and STATA’s “nearest-neighbor” approach. This method uses linear regression to predict values for the outcomes of interest based on a set of explanatory variables. As explanatory variables, we used information on firm size, industry and state. Values are imputed for the observations missing workforce and establishment information using establishments that are similar on these dimensions.
Next, we defined an indicator variable for whether an establishment offers insurance. This indicator took the value of one if the establishment reported offering insurance on the IC survey and had at least one employee enrolled in coverage. While the additional criterion of having at least one employee enrolled affected a very small proportion of observations, it is an important distinction between public-use summary tables from the MEPS-IC and this analysis.
For establishments that offer ESI, we used the plan-level file of the MEPS-IC to construct measures of premiums for three coverage types: single, employee plus one and family coverage. Because establishments may offer more than one health plan, we constructed a weighted average premium using enrollment in each plan as weights. We also constructed measures for the employer contribution to the premium, also weighted by enrollment for employers that offered more than one plan. For establishments that do not offer ESI, we used imputation methods to predict premiums for each coverage type. Explanatory variables included firm size, multi-location establishment, state indicators, industry, business tenure, nonprofit status, percentage of workers 50 years of age and older, percentage of workers female, and union presence.
We also defined an indicator variable for the employer’s Section 125 status, which is important for assessing the value of the tax subsidy. For establishments that do not offer ESI, we used imputation methods to predict Section 125 status. We merged the plan and establishment files of the IC.
Analytic File Development
Economists assume that employers’ decisions regarding compensation reflect workers’ preferences for wages vs. non-wage benefits. We considered differences in workers’ family incomes, family size, age and gender, as well as federal and state tax rates as sources of heterogeneity that influence workers’ preferences for health insurance vs. wages. We used a “cell-based” approach to augment the MEPS-IC file with information from workers in the Household Component that are expected to affect the employer’s decision to offer ESI.
We started by creating 36 unique wage-coverage type-dual-offer cells for each establishment, including establishments that offer ESI and those that do not. We used three wage categories for low- (< $11/hour), medium- ($11-$26/hour) and high-wage (> $26/hour) workers; six coverage type categories for single, employee plus one, family, not enrolled-single, not enrolled-employee plus one and not enrolled-family; and two cells to represent dual offers. The dual-offer cells capture whether a worker was in a family with a spouse who had an ESI offer.1 Part 1 of this process was to create the cell structure and estimate the number of workers in each cell in each establishment. This was done in three steps. In Part 2, we used regression-based methods to predict the attributes of workers in each cell using a set of explanatory variables common to the MEPS-HC and MEPS-IC databases. Below, we describe our methods in greater detail.
Part 1
Estimate the establishment’s wage distribution for full-time workers: Health insurance is disproportionately offered to full-time workers. However, the wage data collected by the MEPS-IC reflect both wage levels for part-time and full-time workers and the distribution of these worker types across establishments. For each establishment, we adjusted the wage distribution to represent full-time workers’ wages. After assessing item non-response, we estimated a set of regressions using the MEPS-IC data for the percentages of low-, medium- and high-wage workers as functions of the percentage of part-time workers, percentage female, the interaction of part-time and female, percentage of workers unionized, the interaction of part-time and unionized workers, the percentage of workers age 50 and older, business tenure, industry, and state. Using the regression model estimates, we predicted the percentages of low-, medium- and high-wage workers at each establishment. To “adjust” the wage distribution to reflect wages of full-time workers, we set the percentage part-time workers equal to zero and predicted the outcomes. We then scaled the predicted values to ensure that they summed to 100.
Construct the coverage type distribution for each establishment’s workers: We used the MEPS-IC and MEPS-HC for this purpose. From the MEPS-IC, we used information to construct variables for the percentage of workers enrolled in single coverage, employee plus one coverage and family coverage, as well as the percentage not enrolled in any plan offered by the employer. If the establishment did not offer ESI, all workers were counted as “not enrolled”. Because the size of the economic incentives vary by coverage type (e.g., the tax subsidy is larger for a family coverage policy than a single policy) and since coverage type is related to a worker’s family structure, we used information from the MEPS-HC to assign the workers not enrolled in a plan into one of the three coverage types (not enrolled-single; not enrolled-employee plus one, and not enrolled-family) to capture what they “would have chosen” if they had been covered.
We began by selecting workers in private-sector organizations within the MEPS-HC Full-Year Consolidated file. To obtain information about whether ESI was held by the worker and the coverage type held, we used information from the MEPS-HC Person-Round-Plan File (PRPL), identifying individuals with ESI and the type of coverage they held. We merged this information to the workers on the Full-Year Consolidated file. Using all workers in private-sector organizations, we then calculated the number of uninsured in each worker’s family to assign them to one of three categories: not enrolled-single (worker is only uninsured person in family), not enrolled- employee plus one (worker and one dependent are uninsured), and not enrolled-family (worker and two or more dependents uninsured).
Finally, we estimated a multinomial logit regression equation to predict the “not enrolled” categories for each worker. Our regression equation included the following explanatory variables: wage category, establishment size, employment in a multi-location establishment, industry, and state. We then used parameter estimates from this regression equation to predict these outcomes for the MEPS-IC cells.
Dual-offer status: We predicted the probability of a worker being in a family with a dual offer of ESI (e.g., spouse has an offer). Explanatory variables included wage category, coverage type, establishment size, employment in a multi-location establishment, industry and state. We predicted this probability and merged it to each wage-coverage cell.
Part 2
Predict family size categories: To calculate the value of exchange subsidies, we need to predict the average family size for each of an establishment’s wage-coverage type-dual-offer cells. To do this, we used the MEPS-HC and the Health Insurance Eligibility Unit identifier (HIEU). The HIEU corresponds to the group of individuals in a family who would be eligible for coverage under a typical employer-based family coverage policy. To predict family size categories, we estimated an ordered logit equation with five outcomes (1, 2, 3, 4, 5+). Explanatory variables included wage category, coverage type, establishment size, multi-location establishment, state and industry. We then predicted these outcomes to the MEPS-IC cells.
Predict family income: Because exchange-based subsidies are determined by family income rather than a worker’s wage income, we calculated family income based on an HIEU-year from the MEPS-HC. After merging state identifiers to the HC, we estimated a regression of family income as a function of wage-coverage type interactions, family size, establishment size, employment at a multi-location establishment, industry and state. We then predicted values to the MEPS-IC cells.
Predict the tax price: Next, we predicted the average tax price for workers in each cell at each establishment. We did this by using information on the subset of workers in the MEPS-HC and TAXSIM software to estimate workers’ marginal federal and state income tax rates, OASDI and Medicare Hospital Insurance taxes (the latter two considered FICA). The tax price is defined as (1-MTR/100)/((1+FICA/2/100)). We regressed the tax price on family income categories, family size category, establishment size, employment in a multi-location establishment, industry and state. We then predicted values of the tax price to the MEPS-IC cells.
We now had 36 cells for each establishment—one for each wage level (low, medium and high), coverage type (single, employee plus one, family, non-enrolled-single, non-enrolled-employee plus one and non-enrolled-family), and dual-offer combination. For each cell in each establishment, we have the estimated number of workers, average family income, average family size, average tax price, Section 125 status, total premium and employer share of the premium.
Economic Incentive Components
Value of the tax subsidy: For each wage-coverage type cell in each establishment in the MEPS-IC, we identified the relevant premium that would be tax exempt under the existing tax code. This equals the employer-paid portion of the premium or the total premium for establishments with Section 125 status. We inflated all premiums to 2014 dollars. We then estimated the value of the tax subsidy by multiplying the tax-exempt premium amount by (1-Tax price) as defined previously.
Penalty: If an employer with at least 50 full-time equivalent workers does not offer coverage and any full-time employee receives a premium tax credit for purchasing insurance on an exchange, the employer will pay a penalty of $2,000 times the number of full-time employees less 30.
We faced two challenges in estimating the penalty. First, the penalty is determined by firm size, but our unit of observation is an establishment. While this is not a problem for single-location establishments in which establishment size equals firm size, it is a problem for establishments with multiple locations. The MEPS-IC provides a measure of firm size associated with the establishment. The second issue we faced is that the penalty is assessed on full-time workers. However, the MEPS-IC does not identify the distribution of full-time versus part-time workers at the firm level. To address this, we used information on the number of part-time and full-time workers at each establishment and assumed that the distributions at the firm and establishment levels are similar. The formula that we use to estimate the penalty is the following: (number in the full-time workers at firm-30)*$2,000*(# employees in establishment/# employees in the firm).
Exchange subsidies: In 2014, subsidies will be available to individuals who lack an offer of ESI. The value of the subsidy equals the premium of the second-lowest cost “silver plan” which has a 70 percent actuarial value (AV), less an amount equal to a percentage of family income. The percentage is determined on a sliding scale based on the family’s income relative to the federal poverty level (FPL).
The Congressional Budget Office has estimated that the premium of a 70 percent AV plan will be $5,300 for single coverage and $15,000 for family coverage in 2016 ($4,762 and $13,476 in 2014 dollars, assuming 5.5% annual real growth).2
We adjusted family incomes to reflect changes in compensation. For workers in establishments that offered insurance, we raised their income by an amount equal to the tax-exempt premium less the penalty and dividing by 1.0765 (since the employer will have to pay payroll taxes on this increase in wages). For workers in establishments that did not have an offer, their income is adjusted downward by the amount of the penalty divided by 1.0765.
We used the FPL guidelines and the subsidy schedule, along with the estimated silver plan premiums, to calculate the out-of-pocket maximum and the value of the subsidy that a worker would obtain based on his/her family income.
The economic incentive of offering health insurance prior to health reform equals the tax subsidy. The economic incentive of offering health insurance after health reform equals the tax subsidy plus the penalty less the exchange subsidy. These variables are measured at the wage-coverage type-dual-offer cell level.
Aggregation to establishment level: As the final step, we aggregated the economic incentive on a pre- and post-reform basis to the establishment-level. We calculated a weighted average, where the weights were the proportion of workers in each of the 36 cells.
Notes
1. The product of 6 x 3 x 2 categories equals 36 distinct cells.
2. Congressional Budget Office (CBO), Selected CBO Publications Related to Health Care Legislation, 2009-2010, Washington, D.C. (December 2010).