Differences in health status explain much of the regional variation in spending for privately insured people, but differences in provider prices—especially for hospital care—also play a key role, according to a study by the Center for Studying Health System Change (HSC) based on claims data for active and retired nonelderly autoworkers and dependents. Although autoworkers’ health benefits essentially are uniform nationally, health spending per enrollee in 2009 varied widely across 19 communities with large concentrations of autoworkers, from a low of $4,500 in Buffalo, N.Y., to a high of $9,000 in Lake County, Ill.
Autoworkers in high-spending communities receive roughly 50 percent more services than those in low-spending communities, but the higher quantity of services appears to be largely accounted for by greater health needs. Autoworkers in high-quantity communities have significantly more disease diagnoses and appear to be much sicker than enrollees in low-quantity communities. At the same time, poorer health among autoworkers appears to reflect a broader syndrome of poor health affecting entire communities.
Moreover, wide differences across communities in the prices paid to health care providers also explain a large share of regional spending variation. For physician office visits, prices paid by the autoworker plan are similar to Medicare prices and vary little across communities. For hospital services, the prices paid by the autoworker plan far exceed Medicare prices and vary widely across communities. The study findings suggest that opportunities to control spending growth lie in restraining hospital prices and improving people’s health status, which will require purchasers to develop new strategies.
- A Fresh Look at Regional Health Spending Variation
- Quantity x Price=Spending
- Sicker People Use More Services
- Comparing Private Prices to Medicare
- Policy Implications
- Notes
- Data Source
- Supplementary Tables
- Technical Appendix
A Fresh Look at Regional Health Spending Variation
Almost all research on health care spending variation has focused on Medicare, hampering full understanding of what drives variations.1 Key differences exist between employer-sponsored health insurance and Medicare, making it critical to examine spending variation among privately insured people and not assume that patterns observed in Medicare also occur among the privately insured.2
This Research Brief examines 2009 data on health care spending and utilization patterns among nonelderly autoworkers represented by the International Union, UAW, and employed by Chrysler, Ford and General Motors—both active workers and retirees—and their dependents (see Data Source). In 2009, the three automakers provided health insurance to more than 1 million people, making them among the largest sources of employer-sponsored health coverage in the United States. This study focuses on a subset of those covered by the automakers in 2009, namely nonelderly unionized autoworkers—both active and retired—and their dependents who were enrolled in preferred provider organizations, primarily Blue Cross Blue Shield plans.
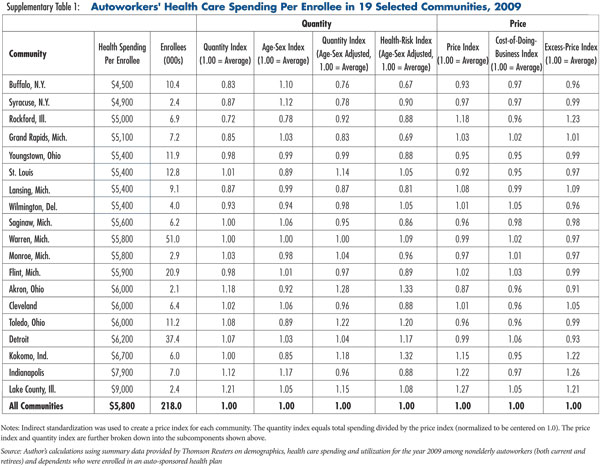
In 2009, autoworker health spending per enrollee varied twofold across the 19 communities studied from a low of $4,500 in Buffalo to a high of $9,000 in Lake County (see Supplementary Table 1). The large variation in spending per enrollee raises two questions: why are some areas more costly than others, and does the pattern of variation suggest strategies for controlling spending growth?
Quantity x Price = Spending
Health care spending equals the quantity of medical services multiplied by the price per service, where the price equals the amount paid to the medical provider from both the insurer and the patient. A community can have high spending because enrollees are receiving large quantities of services, providers are being paid high prices or both. The first step is to sort out the role of prices vs. quantities in explaining why some communities have high spending. The second step is to attempt to explain the differences in prices and quantities to assess whether they are warranted or unwarranted. Large unwarranted differences deserve attention from payers and policy makers.
Quantities. Each of the 19 communities was assigned a quantity index that summarizes the quantity of services received. A value of 1.0 represents the average quantity among all the autoworker communities, a 1.1 represents 10 percent above average and so on. The quantity index is further broken down into an age-sex index, a health-risk index and an unexplained remainder. The age-sex index accounts for differences in enrollees’ age and sex across the communities, while the health-risk index accounts for differences among communities in enrollees’ disease diagnoses.
Prices. Each community also was assigned a price index that summarizes the prices paid by the autoworker plan for all covered health care services. A value of 1.0 represents the average price among all the autoworker communities. The price index is further broken down into two components—the first is a so-called cost-of-doing-business component that reflects rent, prevailing wages for health professionals and other factors, and the second is an unexplained remainder.
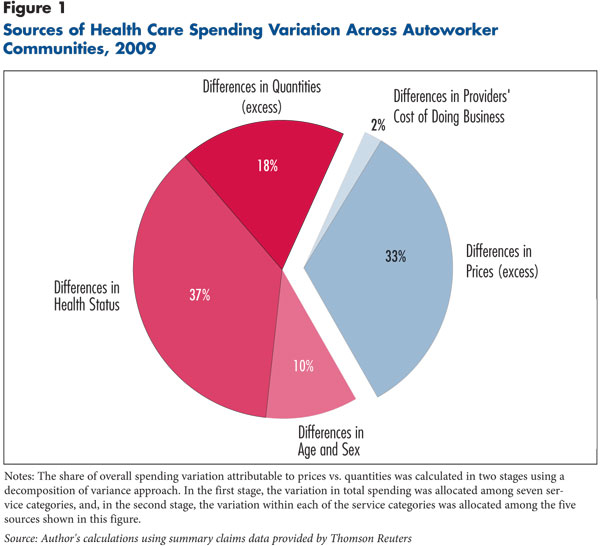
Differences in service quantities account for two-thirds of the overall spending variation, while differences in prices account for one-third (see Figure 1). The lowest-cost communities—Buffalo and Syracuse, N.Y.—have both low prices and low quantities, while the highest-cost communities—Indianapolis and Lake County—have both high prices and high quantities.
On the quantity side, differences in health status and the age-sex index explain most, but not all, of the variation in quantity. About 18 percent of the total variation in spending is a result of unexplained differences in quantities. The unexplained differences in service quantities show up in the data as patients in different communities with similar health risks receiving much different quantities of services. For example, the health-risk score in Syracuse (0.90) is similar to Cleveland (0.88), but the quantity index is almost 25 percent higher in Cleveland (0.96 vs. 0.78). Another example is Detroit and Toledo—those communities have similar health-risk scores (1.17 and 1.20), but the quantity index is almost 20 percent higher in Toledo.
On the price side, the cost of doing business explains very little of the observed price differences, with almost all of the differences in prices unexplained.
Sicker People Use More Services
Differences among communities in the quantity of services could mean enrollees in some communities simply are sicker and need more services. Or, there may be differences in providers’ practice styles, including the intensity with which they treat similar patients. It is difficult to distinguish between the two, but the data generally indicate that differences in health status are a major explanation for why autoworkers in some communities receive high quantities of services.3
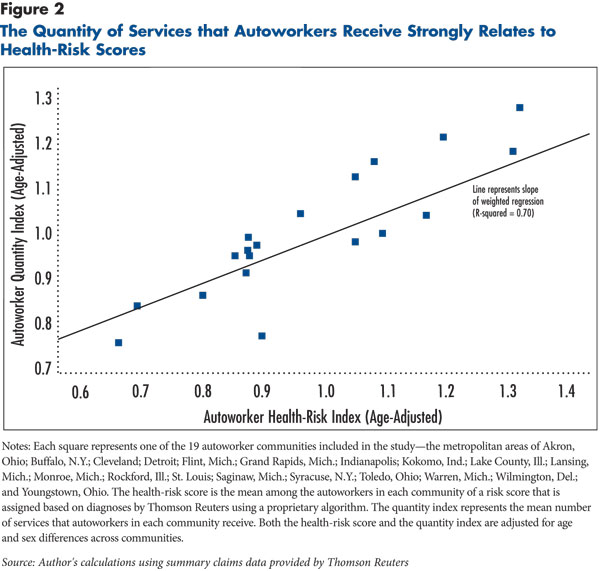
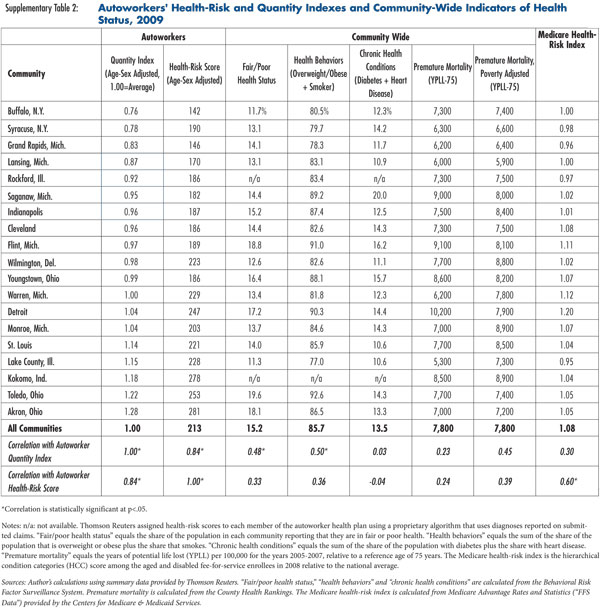
To understand the link between service use and health status, a health-risk index was calculated for each community. The health-risk index is a summary measure of the expected costliness of autoworkers in one community relative to all of the other communities (1.00 is average). The health-risk index, which is based on enrollees’ medical diagnoses reported on insurance claims, varies widely across communities and is strongly related to the quantity index (see Figure 2).4 As stated previously, the health-risk index explains most of the variation in quantities and 37 percent of the overall variation in spending.
The health-risk index has a major vulnerability, however, because it relies on diagnoses reported in health insurance claims. A high health-risk score could indicate poor health, or it could indicate that providers are aggressively ordering diagnostic tests and reporting more diagnoses. To assess whether the health-risk index is, in fact, capturing differences in health status, the autoworker service quantities and health-risk scores were compared with a number of other community-wide indicators of health status that are not based on claims data (see Supplementary Table 2). If high quantities indicate greater need, one would expect to see some correlation with community-wide health indicators.
Across the communities, high health-risk scores and high quantities among autoworkers are associated with poor health-status indicators in the broader community. This supports the theory that quantities are being driven at least in part by poor health and not just differences in providers’ coding and practice styles. Two community-wide indicators from survey data—the first is the share of people reporting “fair” or “poor” health status and the second is the sum of the share of the population that is overweight or obese and the share that smokes—strongly correlate with the quantity of services received by autoworkers. And, autoworkers’ health-risk scores are strongly correlated with a similar health-risk score used for Medicare beneficiaries—this supports the idea that autoworkers’ spending and utilization patterns reflect broader community patterns.5
Another community-wide health indicator—premature mortality as measured by poverty-adjusted years of potential life lost—also is correlated with autoworkers’ quantities of services and health-risk scores, albeit weakly. There is one community-wide health indicator—a chronic conditions indicator equal to the sum of the share of the population with diabetes and the share with heart disease—that does not correlate with the autoworker quantity. The lack of a relationship may reflect the fact that patient self-reports are used to measure the prevalence of diabetes and heart disease, and those conditions frequently go undiagnosed.
Comparing Private Prices to Medicare
Medicare provides a useful external benchmark to compare prices in autoworker communities for three reasons. First, Medicare is by far the largest payer of medical care in the United States. Second, Medicare’s prices are adjusted to take into account regional differences in the cost of doing business, and they are designed to adequately cover the costs of reasonably efficient providers—making them a useful indicator of a reasonable price. Third, Medicare’s prices and price-setting methodology are publicly available and widely known.
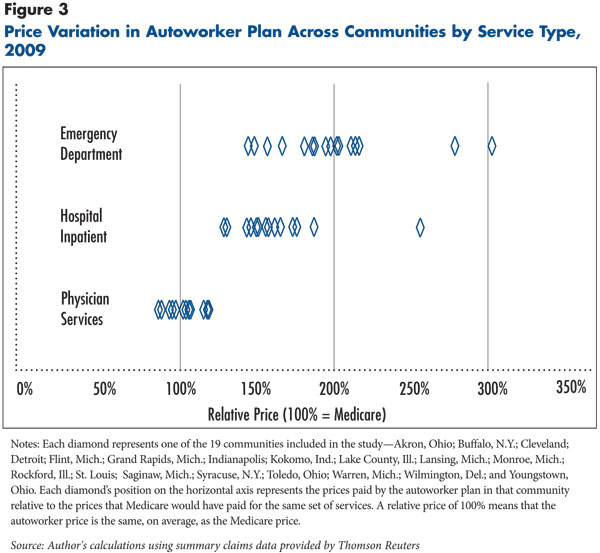
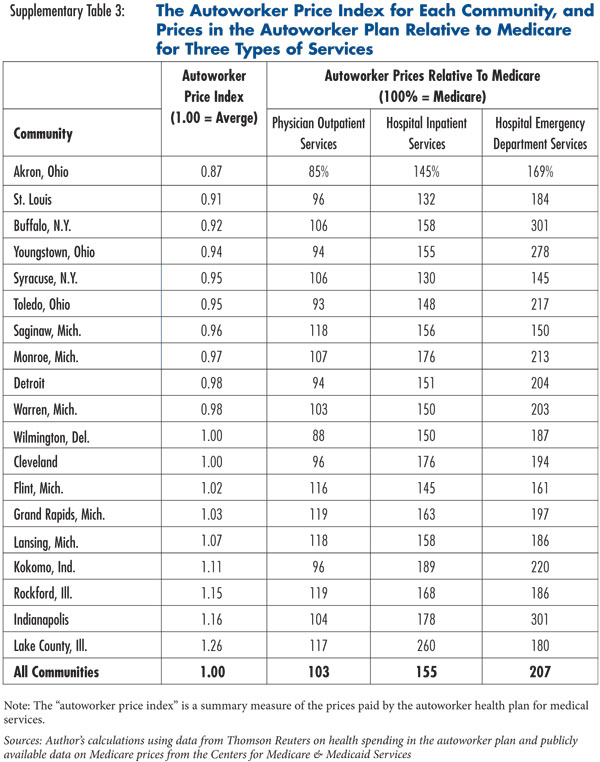
To compare prices paid by the autoworker plan with Medicare prices, three categories of services were examined: physician office visits for evaluation and management services, hospital facility fees for inpatient care, and hospital facility fees for emergency department care. These categories were selected partly because Medicare prices for these services are fairly straightforward to calculate and partly because both Medicare beneficiaries and enrollees in the autoworker plan use a large number of these services.
Physician office visits. The prices paid by the autoworker plan for physician office visits, on average, are only 3 percent higher than what Medicare would have paid for the same services (see Figure 3 and Supplementary Table 3). In eight of the 19 communities, the autoworker plan prices for physician office visits are actually below Medicare. In the highest-price communities, the autoworker plan pays about 20 percent above Medicare.
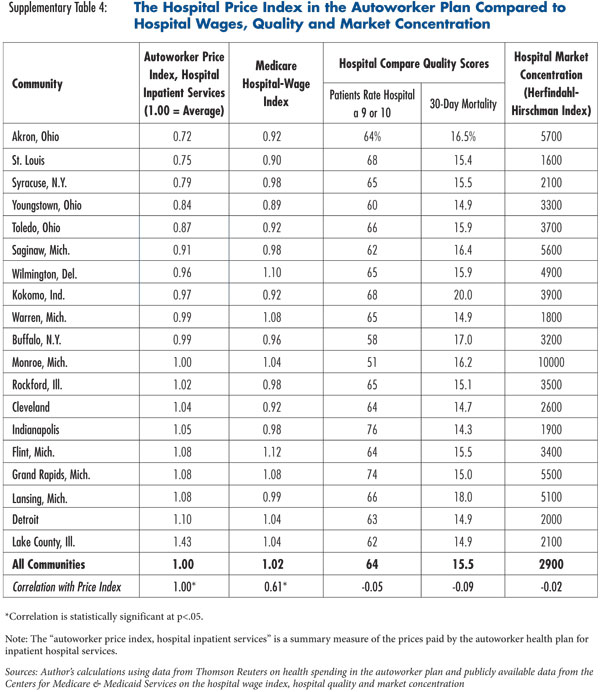
Hospital inpatient care. The prices for inpatient hospital care paid by the autoworker plan are, on average, 55 percent higher than what Medicare would pay, and the price gap varies widely across communities. In the lowest-price communities—Syracuse and St. Louis—the autoworker prices are 30 percent above Medicare. In the highest-price community—Lake County—the autoworker price is more than two-and-half times the Medicare price.
There appears to be no relationship between inpatient hospital prices and objective measures of the quality of the inpatient care or with hospital market concentration (see Supplementary Table 4). Market concentration probably plays a role, but it may be overshadowed by other factors, including hospitals’ reputations, geographic market segmentation within metropolitan areas, and concentration within specialized service lines, such as burn and trauma care. Together, these findings suggest that the ability of hospitals to command high prices rests on factors that are not easily discernible in quantitative measures of quality or market concentration.
Hospital emergency department care. The prices paid by the autoworker plan for hospital emergency department care are, on average, more than double the Medicare price, and the price gap varies even more widely across communities than for inpatient care. In the lowest-price communities, the autoworker plan pays prices about 50 percent higher than Medicare, while in the highest-price community—Indianapolis—the autoworker plan pays prices three times as high as Medicare. The price variation among autoworker communities follows the same general trends identified by previous research.6
Policy Implications
The fact that some communities have unusually high spending in the autoworker health plan is perhaps best pictured as two separate issues: a quantity problem and a price problem.
On the quantity side, there is an appealing notion that one can take high-quantity communities and transform them to look more like low-quantity communities. But taking an Akron or a Toledo and turning it into a Buffalo or a Syracuse would almost certainly require genuine improvements in health and health behaviors. The jury is still out on the potential for workplace wellness programs to produce such improvements.7 Broader programs that would improve community-wide health, such as the Community Transformation Grants in the 2010 Patient Protection and Affordable Care Act, are likewise of uncertain effectiveness, but at least attempt to address the problem at the right level.
For those already living with complex chronic conditions, the policy focus on improving care coordination among health care providers across care settings—for example, through patient-centered medical home initiatives—may hold promise. Moreover, the finding that 18 percent of the total variation in spending across the 19 communities is a result of unexplained differences in quantities suggests there is significant room to improve care delivery and increase efficiency.
On the price side, some communities, such as Lake County, are clearly out of line. Two broad options are available to address rapidly rising provider payment rates to private insurers—market forces and regulation.8
The market approach involves changes in insurance products to engage enrollees in selecting providers on the basis of price and quality. There are two main approaches to limiting provider networks—narrow networks and tiered networks. Narrow-network products exclude non-preferred providers from the network altogether, while tiered-network products place these providers in tiers requiring higher patient cost sharing at the point of service. To the degree that many purchasers in a community use these network approaches, savings from more judicious choices of providers can be augmented by provider responses to shifts in market share. Whether additional savings can be obtained by provision of provider price data throughout the community is uncertain.
The alternative to market forces is rate review or rate setting by a public entity, most likely at the state level. Rate setting could take relatively loose forms, such as a limit based on Medicare payment rates, or a more structured approach, such as the all-payer-rate system used in Maryland or West Virginia’s system of reviewing rates charged to private payers.
Notes
1. The Dartmouth Atlas of Health Care is the best-known source of information on regional variation in Medicare spending (www.dartmouthatlas.org). The focus on Medicare is partly because of its large market share and nationally uniform benefit structure, but mostly because of the availability of detailed Medicare claims data and the difficulties involved in obtaining detailed claims data on large populations of privately insured people. Five notable recent studies examine regional variation in spending among the privately insured: Baker, Laurence C., Elliot S. Fisher and John E. Wennberg, “Variations In Hospital Resource Use For Medicare And Privately Insured Populations In California,” Health Affairs, Web exclusive (March 2008); Chernew, Michael E., et al., “Geographic Correlation Between Large-Firm Commercial Spending and Medicare Spending,” American Journal of Managed Care, Vol. 16, No. 2 (February 2010); Philipson, Tomas J., Darius Lakdawalla and Dana Goldman, Addressing Geographic Variation and Health Care Efficiency: Lessons for Medicare from Private Health Insurers, Health Policy Outlook No. 2, American Enterprise Institute for Public Policy Research, Washington, D.C. (July 2010); and Franzini, Luisa, Osama I. Mikhail and Jonathan S. Skinner, “McAllen and El Paso Revisited: Medicare Variations Not Always Reflected in the Under-Sixty-Five Population,” Health Affairs, Vol. 29, No. 12 (December 2010).
2. There are at least three key differences between Medicare and employer-sponsored insurance for the nonelderly. First, types of illness vary. End-of-life care accounts for a much smaller share of spending among the nonelderly privately insured than among Medicare beneficiaries. Second, private insurers lack Medicare’s ability to set relatively uniform administered prices. Third, private insurers apply utilization management tools to a greater extent than Medicare.
3. There is an ongoing debate over the extent to which geographic differences in health care spending can be explained by health status vs. practice style. The researchers who produce the Dartmouth Atlas have concluded, based on their analyses of Medicare spending, that “differences in health explain only a small part of the regional variations.” See Sutherland, Jason M., Elliot S. Fisher and Jonathan S. Skinner, “Getting Past Denial—The High Cost of Health Care in the United States,” New England Journal of Medicine, Vol. 361, No. 13 (Sept. 24, 2009). Other researchers, also using Medicare data but applying different methods, have concluded that, “Among high-cost [Medicare] beneficiaries, health was the predominant predictor of costs.” See Reschovsky, James D., et al., “Following the Money: Factors Associated with the Cost of Treating High-Cost Medicare Beneficiaries,” Health Services Research, Vol. 46, No. 4 (Feb. 9, 2011). Disentangling the roles played by health status and practice style is difficult because researchers do not generally have access to objective measures of health status, such as blood-sugar levels or cardiac output. Instead, in regional variations research, health status is generally measured using disease diagnoses recorded in health insurance claims. See Song, Yunjie, et al., “Regional Variations in Diagnostic Practices,” New England Journal of Medicine, Vol. 363, No. 1 (July 1, 2010).
4. The health-risk score was assigned to each autoworker enrollee by Thomson Reuters using its proprietary DxCG algorithm. The health-risk index equals the ratio of the health-risk score in one autoworker community to the average health-risk score among all autoworker communities. The health-risk index is adjusted for age and sex, which means that it reflects differences in health-risk scores above and beyond what would be expected solely based on differences in age and sex distributions.
5. The Medicare health-risk score is the hierarchical condition categories (HCCs) for the aged and disabled in 2008. HCCs are used by Medicare to risk-adjust premium payments to Medicare Advantage plans.
6. Ginsburg, Paul B., Wide Variation in Hospital and Physician Payment Rates Evidence of Provider Market Power, Research Brief No. 16, Center for Studying Health System Change, Washington, D.C. (November 2010); and Ginsburg, Paul B., Health Care Provider Market Power, Statement before the U.S. House of Representatives, Committee on Ways and Means, Subcommittee on Health, Washington, D.C. (Sept. 9, 2011).
7. Tu, Ha T., and Ralph C. Mayrell, Employer Wellness Initiatives Grow, but Effectiveness Varies Widely, Research Brief No. 1, National Institute for Health Care Reform, Washington, D.C. (July 2010).
8. Ginsburg (2011).
Data Source
The Center for Studying Health System Change (HSC), under an agreement with Thomson Reuters, obtained summary demographic and health care spending and utilization data for the year 2009 on autoworkers (both current and retirees) and dependents who were enrolled in an auto-sponsored health plan. The study population excluded salaried workers, anyone aged 65 or older, anyone enrolled in Medicare, and anyone enrolled in a health maintenance organization (HMO). The data also only included enrollees living in selected communities with relatively large concentrations of autoworkers. After applying those exclusion criteria, the study population included 218,000 enrollees in 19 communities the metropolitan areas of Akron, Ohio; Buffalo, N.Y.; Cleveland; Detroit; Flint, Mich.; Grand Rapids, Mich.; Indianapolis; Kokomo, Ind.; Lake County, Ill.; Lansing, Mich.; Monroe, Mich.; Rockford, Ill.; St. Louis; Saginaw, Mich.; Syracuse, N.Y.; Toledo, Ohio; Warren, Mich.; Wilmington, Del.; and Youngstown, Ohio.
The health spending data used in this study have not been used previously for variations research, and they have several advantages. The most obvious is that the data include a large population of nonelderly privately insured people living in a number of different communities. Also, although benefits vary slightly by company, within each company they are uniform nationally. This means that autoworkers in different communities enroll in plans with benefits that are more or less identical, which makes conclusions easier to draw any cost differences are not a result of differences in benefits. Compared to Medicare, with its variety of supplemental coverage from various sources, the autoworkers’ benefits are substantially more uniform. Finally, the fact that all of the enrollees are current or former hourly autoworkers or their dependents means that they are similar in their socioeconomic characteristics, which also helps narrow the range of possible explanations for observed spending differences.
Indirect standardization was used to create a price index for each community that measures the ratio of actual spending in the community over the hypothetical amount of spending if prices in the community were equal to the average prices among all autoworker communities. The quantity index equals total spending divided by the price index and normalized to be centered on 1.0. The price index was broken down into a cost-of-doing-business index and an unexplained remainder, and the quantity index was broken down into an age-sex index, a health-risk index and an unexplained remainder.
Several data sources were used to measure health status and health spending among the broader populations not just autoworkers—living in the 19 communities. For more details on the Thomson Reuters data and the other data sources, see the Technical Appendix.
Supplementary Tables
Technical Appendix
The Center for Studying Health System Change (HSC), under an agreement with Thomson Reuters, obtained summary demographic and health care spending and utilization data for the year 2009 on autoworkers (both current and retirees) and dependents who were enrolled in an auto-sponsored health plan. Thomson Reuters, which collects claims data for the auto-sponsored health plans, accessed and processed the data under agreements with Chrysler Group L.L.C.; Ford Motor; General Motors; and the International Union, UAW. The data were summarized by Thomson Reuters at the community level before being transmitted to HSC, and no individual identifiers or individual-level data were used in the study.
The study population excluded salaried workers, anyone aged 65 or older, anyone enrolled in Medicare, and anyone enrolled in a health maintenance organization (HMO). The data also only included enrollees living in selected communities with relatively large concentrations of autoworkers. After applying those exclusion criteria, the study population included 218,000 enrollees in 19 communities. The 19 communities included in the study were defined using a crosswalk from the enrollee’s zip code of residence to metropolitan area. The community definitions generally conform with metropolitan statistical areas (MSAs), as defined by the Office of Management and Budget. The one exception is the Detroit-Warren-Livonia MSA, which was subdivided into the Detroit metropolitan division, which includes only Wayne County, Mich.; and Warren-Troy-Farmington Hills, Mich., which includes the other five counties in the Detroit-Warren-Livonia MSA. The MSA codes corresponding to each of the communities are: Akron, Ohio—10420, Buffalo, N.Y.—15380, Cleveland—17460, Detroit—19804, Flint, Mich.—22420, Grand Rapids, Mich.—24340, Indianapolis—26900, Kokomo, Ind.—29020, Lake County, Ill.—29404, Lansing, Mich.—29620, Monroe, Mich.—33780, Rockford, Ill.—40420, Saginaw, Mich.—40980, St. Louis—41180, Syracuse, N.Y.—45060, Toledo, Ohio—45780, Warren, Mich.—47644, Wilmington, Del.—48864, Youngstown, Ohio—49660.
Price and quantity indexes. The method of indirect standardization was used to construct an overall price index for each community, and separate price indexes for each of seven service categories (hospital inpatient facility, hospital outpatient facility, physician office-based, physician hospital-based, prescription drug, laboratory/radiology, and other professional). The indirect standardization approach first measures the average price among all communities for each specific type of service within each service category. The definition of specific type of service depended on the service category. For example, hospital inpatient services were categorized based on diagnosis-related groups (DRGs), while physician office-based services were categorized using either current procedural terminology (CPT) or Healthcare Common Procedure Coding System (HCPCS) codes. For each combination of community and service category, a price index was then calculated by comparing the actual allowed amount in a given community with the hypothetical allowed amount calculated using the all-communities average price. An all-services price index was then calculated for each community by weighting the price index for each service category by that service category’s share of the total allowed amount in that community.
Quantity indices for each service category and for all service categories were calculated by dividing the allowed amount by the appropriate price index and rescaling so that the quantity indices would be centered on 1.0.
An age-sex index was calculated for each community by calculating the predicted allowed amount for each community relative to the average among all communities, where the prediction is based on the mean spending within 5-year age-sex categories (<1 male, <1 female, 1-4 male, 1-4 female, 5-9 male, 5-9 female, etc.) and the distribution of enrollees across 5-year age-sex categories in each community. The age-sex adjusted quantity index equals the quantity index divided by the age-sex index. The cost-of-doing-business index is calculated using Medicare geographic adjustors that measure hospital wages, rents and so on.
Decomposition of variation. The share of overall spending variation attributable to prices vs. quantities (shown in Figure 1) was calculated in two stages using a decomposition of variance approach. In the first stage, the variation in total spending was allocated among the seven service categories. This was done by calculating a 7-by-7 enrollee-weighted variance-covariance matrix where each row and each column represents a service category, and where each of the 19 data points represents a community. Note that the sum of the amounts in the service categories equals total spending. The share of the total variation allocated to each service category equals the row-sum (or, equivalently, column-sum) from the variance-covariance matrix divided by the enrollee-weighted variance in community-level spending per enrollee. Then, for each service category a 5-by-5 enrollee-weighted variance-covariance matrix was calculated where the rows (columns) represent the following: the natural logarithm of the cost-of-doing-business index, the natural logarithm of an excess-price index (i.e. the ratio of the price index over the cost-of-doing business index), the natural logarithm of the age-sex index, the natural logarithm of the age-sex adjusted health-risk index, and the natural logarithm of the age-sex-price-risk-adjusted quantity index (i.e. the quantity index divided by the product of the age-sex index, the price index, and the health-risk index). Note that the sum of those five elements by definition equals the natural logarithm of the unadjusted cost index. The share of variation attributable to each of the five elements was then calculated by taking the row-sum (or, equivalently, the column-sum) and dividing by the total variance in the natural logarithm of the unadjusted cost index. The share of variation attributable to the cost of doing business is then calculated as the sum product of the share of variation in each service category by the share of variation within each service category attributable to the cost of doing business, and so on.
Community Health Indicators and Other Indicators
A number of different data sources were used to conduct the study.
Community-wide fair/poor health status; overweight/obese plus smoker; and diabetes plus heart disease (Supplementary Table 2) are taken from the Centers for Disease Control and Prevention’s 2009 Behavioral Risk Factor Surveillance System (BRFSS).
Years of potential life lost before age 75 (YPLL-75) (Supplementary Table 2) is calculated from data provided by the National Center for Health Statistics. Premature mortality is difficult to use as an outcome measure because it is very strongly related to the poverty rate among the autoworker communities, differences in the poverty rate can explain about 80 percent of the variation in the rate of premature mortality. Because YPLL is so strongly related to poverty, a poverty-adjusted YPLL was calculated, which reflects the difference between the YPLL in a community and what would be expected based on that community’s poverty rate.
Poverty is calculated from data for 2007 reported in the county-level Area Resources File based on data from the Census Bureau’s Small Area Income Poverty Estimates (SAIPE) files.
The Medicare health-risk index is the hierarchical condition categories (HCC) score among the aged and disabled fee-for-service enrollees in 2008 relative to the national average.
The Medicare hospital-wage index is calculated from data provided by the Centers for Medicare and Medicaid Services (CMS) and is weighted by the number of Medicare admissions provided by each hospital.
Hospital Compare quality scores are calculated from hospital-level data reported by CMS, weighted by the number of cases.
Herfindahl-Hirschman Index (HHI) is calculated from Medicare hospital cost reports for 2009 merged with hospital system identifiers from the American Hospital Association. The HHI represents market concentration using all discharges (not just Medicare), and treating as single units any hospitals that operate within the same community and that are members of the same system.
Autoworker prices compared to the Medicare price benchmark is based on a hypothetical Medicare price calculated by taking the actual services provided to autoworkers in each community and then applying Medicare’s price-setting methodology. This allows a comparison between the price that was actually paid by the autoworker plan with the hypothetical price that Medicare would have paid for the same set of services. For physician office visits, 10 of the most common CPT codes were included (99203, 99204, 99212, 99213, 99214, 99215, 99243, 99244, 99245 and 99396). For both hospital inpatient and emergency department care, the price is the facility fee paid to the hospital, excluding any separately billed amounts for physician services. For hospital emergency department visits, four of the most common CPT codes were included (99282, 99283, 99284 and 99285). For hospital inpatient services, all discharges were included.