Introduction
Since the launch of the Affordable Care Act’s (ACA) coverage expansion in 2014, millions of previously uninsured Americans have enrolled in health insurance.[1] The ACA coverage expansion has two primary components: expansion of Medicaid eligibility to low-income adults and financial assistance to help individuals purchase private coverage through the health insurance marketplaces. Expanded health insurance coverage under the ACA has coincided with improved access to medical care[2] and reductions in problems paying medical bills for many families.[3] In addition, providers have seen a reduction in uncompensated care costs since the ACA coverage expansion began.[4]
Combined with a decreasing unemployment rate, the ACA coverage expansion contributed to a sharp decrease in Michigan’s uninsured rate in 2014. However, effects of the coverage expansion have been uneven, and socioeconomic and geographic disparities in coverage remain across the state.[5] This brief describes the coverage expansion for southeast Michigan (Livingston, Macomb, Monroe, Oakland, Washtenaw, and Wayne counties) and the reductions in the uninsured population. It also examines the remaining uninsured population and the potential for further gains in health insurance coverage.
Key Findings
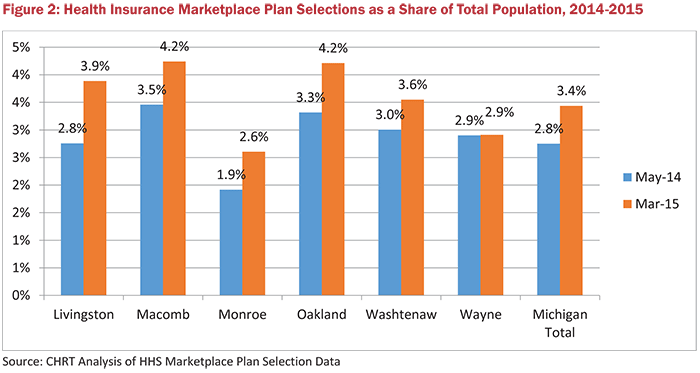
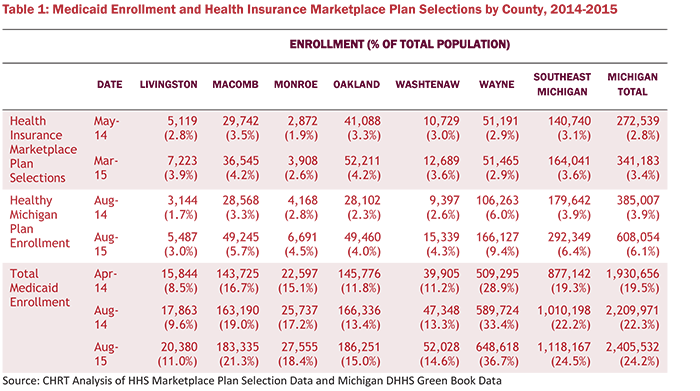
- The number of residents in southeast Michigan who selected a marketplace plan during open enrollment increased from about 141,000 in 2014 to 164,000 in 2015. However, the number of plan selectors was virtually unchanged in Wayne County.
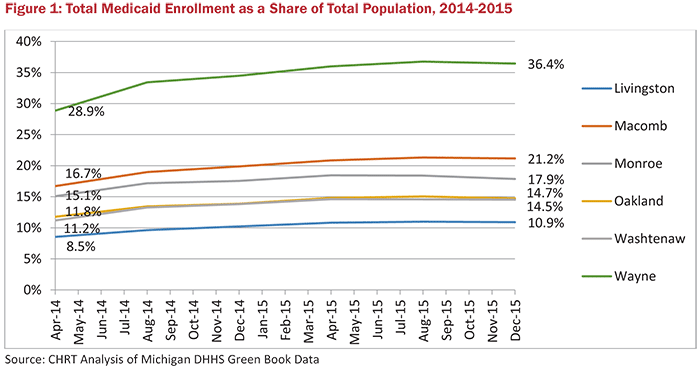
- Total Medicaid enrollment, including both traditional Medicaid and Healthy Michigan Plan (Michigan’s Medicaid expansion program) enrollment, grew in each county in southeast Michigan, increasing from about 877,000 prior to launch of the Healthy Michigan Plan in April 2014 to 1.12 million in August 2015. In Wayne County, more than 36% of residents were enrolled in Medicaid by December 2015.
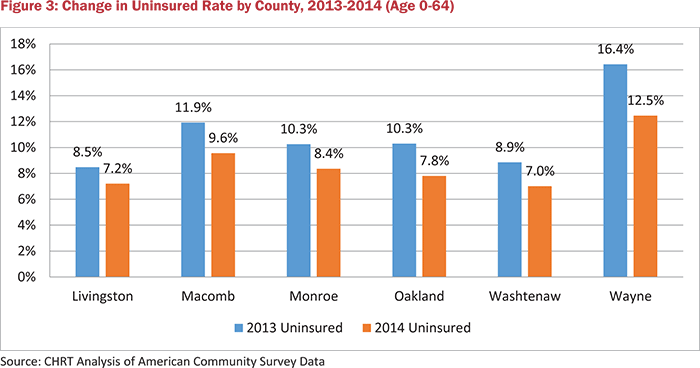
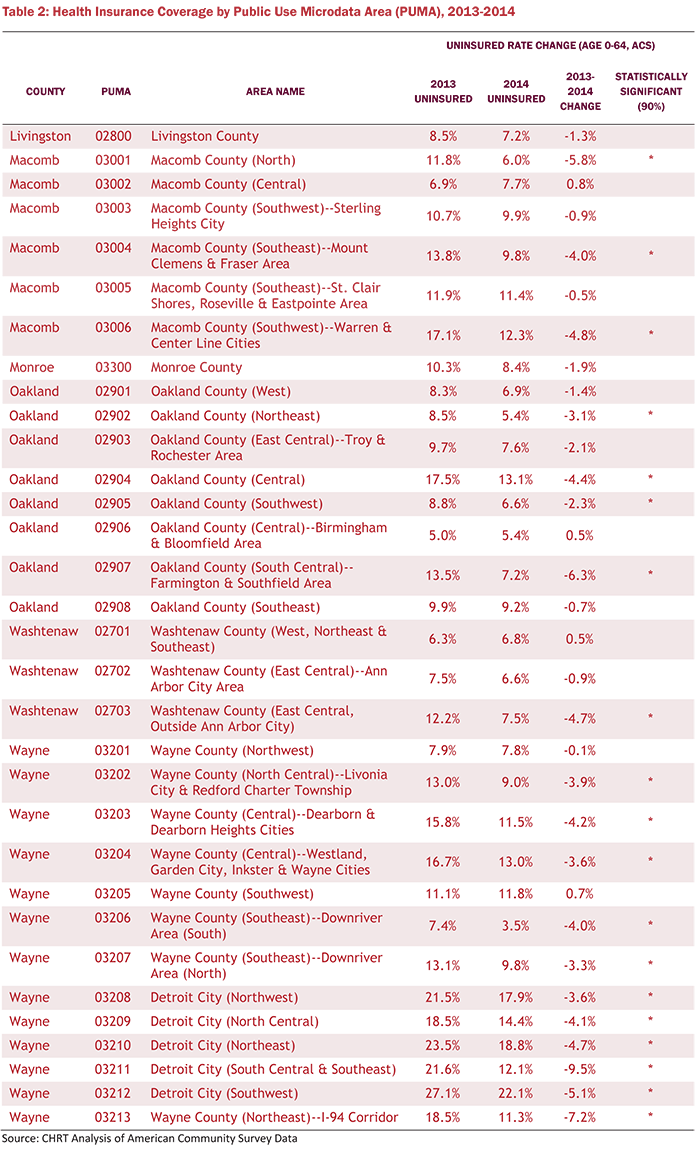
- Every county in southeast Michigan experienced a decrease in the number of uninsured residents from 2013 to 2014, with Wayne County experiencing the sharpest decrease, from 16.4 to 12.5%.
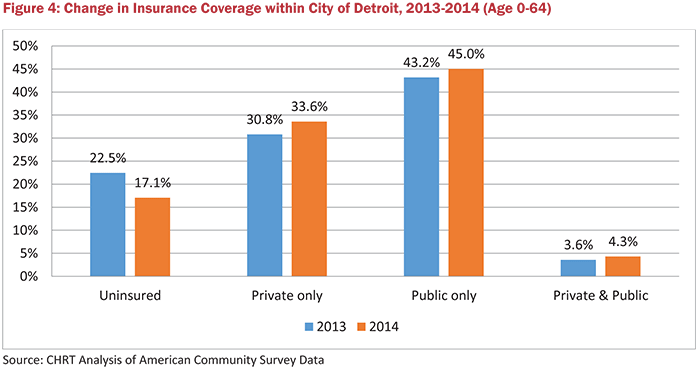
- Within the City of Detroit, the uninsured rate fell from 22.5 to 17.1% in 2014 as both public and private coverage increased.
- Areas within the City of Detroit experienced the largest coverage gains in the region in 2014, but the magnitude of coverage gains varied across the region.
- Across southeast Michigan in 2014, more than three out of four uninsured residents were eligible for financial assistance under the ACA, either through Medicaid, the Children’s Health Insurance Program (CHIP), or subsidies through the health insurance marketplace.
ACA Coverage Expansion
lThe ACA expands health insurance coverage through expansion of the Medicaid program and financial assistance to help individuals purchase coverage through the health insurance marketplaces. In 2012, the Supreme Court ruled that the Medicaid expansion provision of the ACA was optional for states; 31 states and the District of Columbia have adopted the expansion as of February 2016.[6] Medicaid expansion allows states to cover adults below 138% of the federal poverty level (FPL) with an enhanced federal match rate.[7] Michigan adopted the ACA’s Medicaid expansion and launched the Healthy Michigan Plan on April 1, 2014. Similar to other states, the Healthy Michigan Plan covers many low-income parents and childless adults who were not eligible for Medicaid before the launch of the program.
The health insurance marketplace is a program that allows consumers to shop for private coverage and compare available plans offered by different insurers. Through its state-federal partnership with the U.S. Department of Health and Human Services (HHS), Michigan is one of 37 states that uses the federal marketplace (healthcare.gov). Financial assistance is available to consumers who have incomes between 100 and 400% of the FPL and are not eligible for Medicaid or affordable employer-based coverage.[8] Since Michigan expanded Medicaid, the income range for financial assistance is effectively 138 to 400% of the FPL. Assistance is available in the form of tax credits to lower premium costs and cost-sharing reductions (to those below 250% of the FPL), to lower deductibles, co-pays, and other out-of-pocket costs.
Medicaid and the Healthy Michigan Plan
Expansion of Medicaid through the Healthy Michigan Plan has resulted in substantial increases in the number of residents covered by Medicaid in Michigan. By the end of 2015, enrollment in Healthy Michigan reached 613,000 statewide, and total Medicaid enrollment (including both traditional Medicaid and Healthy Michigan Plan enrollment) was over 2.37 million, an increase from 1.93 million in April 2014 when Healthy Michigan launched. In southeast Michigan, each county experienced substantial increases in the number of residents covered by Medicaid, but the share of residents covered by Medicaid varied considerably across counties (Figure 1). In Wayne County, 36.4% of residents were enrolled in Medicaid or the Healthy Michigan Plan in December 2015, compared to 10.9% of residents in Livingston County. Medicaid enrollment across the region increased from about 877,000 in April 2014 to 1.12 million in August 2015. Full details are available in Appendix Table 1.
Health Insurance Marketplace
October 1, 2013 marked the beginning of the first open enrollment period on the health insurance marketplace, which ended on March 31, 2014. During this initial open enrollment period, more than 272,000 Michigan residents selected a health plan that provided coverage as early as January 1, 2014. In 2015, the number of plan selections increased to more than 341,000.[9] In southeast Michigan, the number of plan selections increased from about 141,000 to 164,000. Each county in the region experienced growth in the number of people selecting marketplace coverage from 2014 to 2015, but growth was uneven. For example, the number of those who selected a plan grew by 27% in Oakland County but was virtually unchanged in Wayne County. Livingston, Macomb, Oakland, and Washtenaw counties had marketplace enrollment rates above the state average in 2015, while Monroe and Wayne counties had below average enrollment rates (Figure 2).
The limited growth in Wayne County could be due to the delayed effective date of the Healthy Michigan Plan. Since Healthy Michigan began after the first open enrollment period ended on March 31, 2014, residents between 100 and 400% of the FPL were eligible for marketplace subsidies. With Healthy Michigan in place the following year, the subsidy window decreased to 138 to 400% of the FPL because those between 100 and 138% of the FPL became eligible for Medicaid. The effect of eligibility changing for those between 100 and 138% of the FPL disproportionately affected Wayne County.
Uninsured Reductions
The uninsured population in southeast Michigan declined from about 500,000 in 2013 to 384,000 in 2014 with the launch of the financial assistance through the health insurance marketplace in January 2014 and the Healthy Michigan Plan in April 2014. All counties in southeast Michigan experienced a decrease in their uninsured population, but the sharpest decline was in Wayne County where the uninsured rate fell from 16.4% to 12.5% (Figure 3).
Within the City of Detroit, the uninsured rate fell from 22.5% in 2013 to 17.1% in 2014 (Figure 4). Coinciding with the drop in uninsured, both private and public coverage increased in Detroit. In 2014, 45% of non-elderly residents had public health insurance coverage, primarily through traditional Medicaid, the Healthy Michigan Plan, and CHIP.
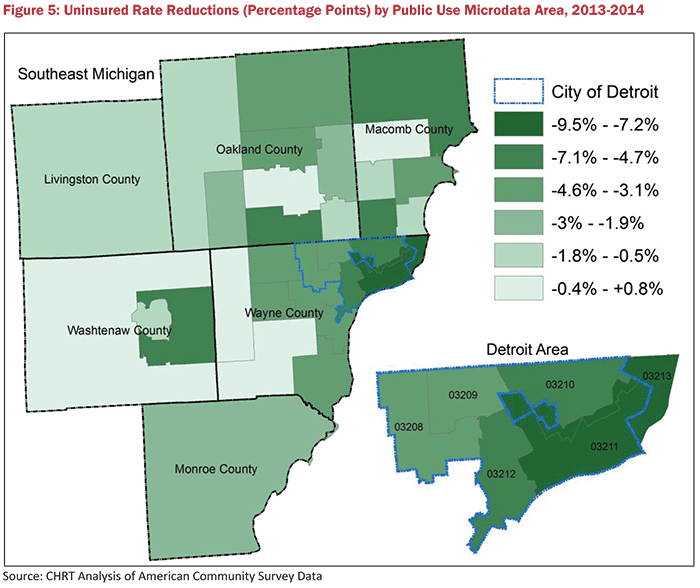
Across southeast Michigan and within Detroit, coverage gains were uneven, with some communities experiencing larger decreases in the uninsured population than others. For example, the uninsured rate in South Central & Southeast Detroit dropped from 21.6 to 12.1% (identified as PUMA 03211 in Figure 5). However, areas of Oakland, Macomb, Wayne, and Washtenaw counties experienced more moderate reductions in their uninsured rates. Full details are available in Appendix Table 2.
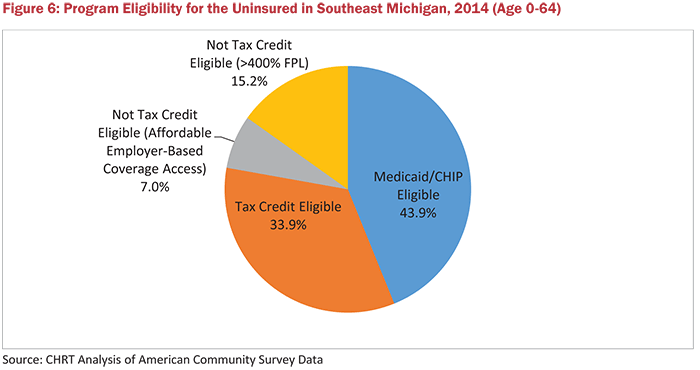
Of the 384,000 remaining uninsured residents in southeast Michigan in 2014, nearly 78% were eligible for financial assistance to make coverage more affordable (Figure 6). Nearly 44% of the uninsured were eligible for Medicaid (including the Healthy Michigan Plan) or CHIP, and nearly 34% of the uninsured were eligible for subsidies through the marketplace.
On the other hand, 22% of the uninsured were not eligible for either program due to having too large a family income or having access to affordable employer-based coverage. However, the share of uninsured not eligible for financial assistance may be an underestimate, since Census data does not include information on the legal immigration status of respondents. Legally-present immigrants with less than five years of residency are not eligible for Medicaid, and unauthorized immigrants are neither eligible for Medicaid nor marketplace coverage.
Conclusion
The first year of the ACA’s coverage expansion has resulted in a significant decrease in the number of uninsured residents in southeast Michigan. However, coverage gains have been uneven and a substantial number of residents remained uninsured in 2014. While enrollment in Medicaid and the health insurance marketplace has grown over the first two years of their implementation, a sizable number of uninsured are likely eligible for one program or the other. As implementation of the coverage expansion continues, it will be important to monitor the coverage gains in southeast Michigan and the disparities that may continue to exist.
Data and Methodology
This brief relied on both administrative and survey data to measure the changes in coverage in Michigan. Medicaid enrollment analysis was conducted using data from the Michigan Department of Health and Human Services.[10] Green Book, which provides monthly county-level enrollment data for Medicaid and the Healthy Michigan Plan.[11] Data on health insurance marketplace enrollment was available from the U.S. Department of Health and Human Services at the ZIP code level,[1] which we converted to the county-level using crosswalks from the Missouri Census Data Center.[12]
To calculate changes in the uninsured population and those with coverage, we used the Census Bureau’s American Community Survey (ACS), which asks respondents about their health insurance coverage at the time they are answering the survey. The ACS includes sub-state level regions known as Public Use Microdata Areas (PUMAs), which we used to examine regional variation in coverage gains in southeast Michigan. Since the ACS is administered throughout the year, some low-income uninsured respondents who answered the survey before April 1, 2014 eventually became eligible for the Healthy Michigan Plan. Therefore, the ACS likely underestimated the coverage gains in Michigan in 2014.
Appendix
Notes
- Uberoi, K. Finegold, and E. Gee. Health Insurance Coverage and the Affordable Care Act, 2010–2016. US Department of Health and Human Services. March 2016. https://aspe.hhs.gov/pdf-report/health-insurance-coverage-and-affordable-care- act-2010-2016 (accessed 3/18/16).
- B. Ward, T.C. Clarke, G. Freeman, and J.S. Schiller. Early Release of Selected Estimates Based on Data from the 2014 National Health Interview Survey. National Center for Health Statistics. June 2015. http://www.cdc.gov/nchs/data/nhis/earlyrelease/earlyrelease201506.pdf (accessed 3/18/16).
- R.A. Cohen and J. Schiller. Problems Paying Medical Bills Among Persons Under Age 65: Early Release of Estimates From the National Health Interview Survey, 2011–June 2015. National Center for Health Statistics. December 2015. http://www.cdc.gov/nchs/data/nhis/earlyrelease/probs_paying_medical_bills_jan_2011_jun_2015.pdf (accessed 3/18/16).
- American Hospital Association. Uncompensated Hospital Care Cost Fact Sheet. January 2016. http://www.aha.org/content/16/uncompensatedcarefactsheet.pdf (accessed 3/17/16).
- J. Fangmeier & M. Udow-Phillips. The Uninsured in Michigan, 2014. Cover Michigan 2016 (Ann Arbor, MI: Center for Healthcare Research and Transformation, 2016). http://www.chrt.org/publication/uninsured-michigan-2014/
- Henry Kaiser Family Foundation. Status of State Action on the Medicaid Expansion Decision. March 2016. http://kff.org/health-reform/state-indicator/state-activity-around-expanding-medicaid-under-the-affordable-care-act/ (accessed 3/18/16).
- The match rate is 100% (full federal funding) for 2014 to 2016 and decreases to 90% for 2020 and beyond.
- In 2014, employer-based coverage was considered affordable if employee’s contribution for self-only coverage did not exceed 9.5% of the employee’s household income. This percentage increased to 9.56% for 2015 and 9.66% for 2016.
- Note: selection of a marketplace plan is not considered full enrollmen In order to be considered fully enrolled, residents much also pay their first month’s premium.
- Michigan Department of Health and Human Services. Green Book of Key Program Statistics. http://www.michigan.gov/mdhhs/0,5885,7-339-73970_61179_10830—,00.html (accessed 3/18/16).
- US Department of Health and Human Services. Plan Selections by ZIP Code in the Health Insurance Marketplace. April 201 https://aspe.hhs.gov/plan-selections-zip-code-health-insurance-marketplace-april-2015 (accessed 3/18/16).
- Missouri Census Data Cen MABLE/Geocorr12: Geographic Correspondence Engine. http://mcdc.missouri.edu/websas/geocorr12.html (accessed 3/18/16).